
The U.S. stock market indexes gained 1.2-1.7% on Friday, as they retraced some of the recent decline. The S&P 500 index fell over 200 points from its record high of 3,027.98 recently. Then it retraced more than 120 points of that sell-off, before getting back to the low again on Thursday. But on Friday the Dow Jones Industrial Average gained 1.2% and the Nasdaq Composite gained 1.7%.
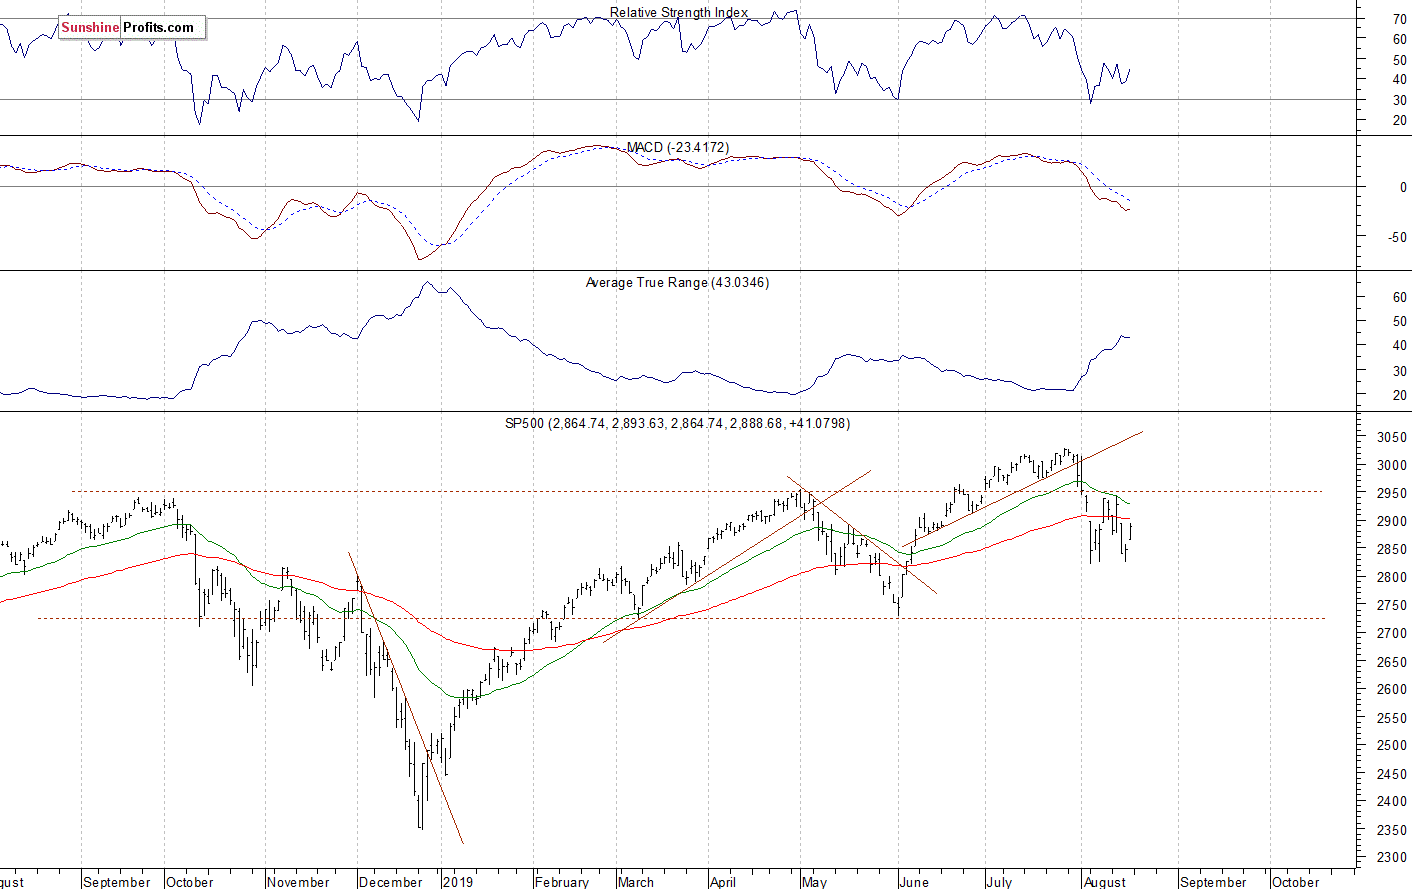
The nearest important resistance level of the S&P 500 index is now at around 2,900. The next resistance level is at 2,940-2,950, marked by last week’s local high. On the other hand, the support level is at 2,855-2,865, marked by Friday’s daily gap up of 2,856.67-2,864.74.
The broad stock market broke below its two-month-long upward trend line in early August, and then it quickly retraced most of the June-July advance. The S&P 500 index remains below the previous medium-term local highs. For now, it looks like a consolidation following the January-February advance. However, it could also play out as a long-term topping pattern ahead of a more meaningful downward correction:

Positive Expectations Again
The index futures contracts trade 1.2-1.4% above their Friday’s closing prices. So expectations before the opening of today’s trading session are very positive again. The European stock market indexes have gained 1.3-1.4% so far. There will be new important economic data releases today.
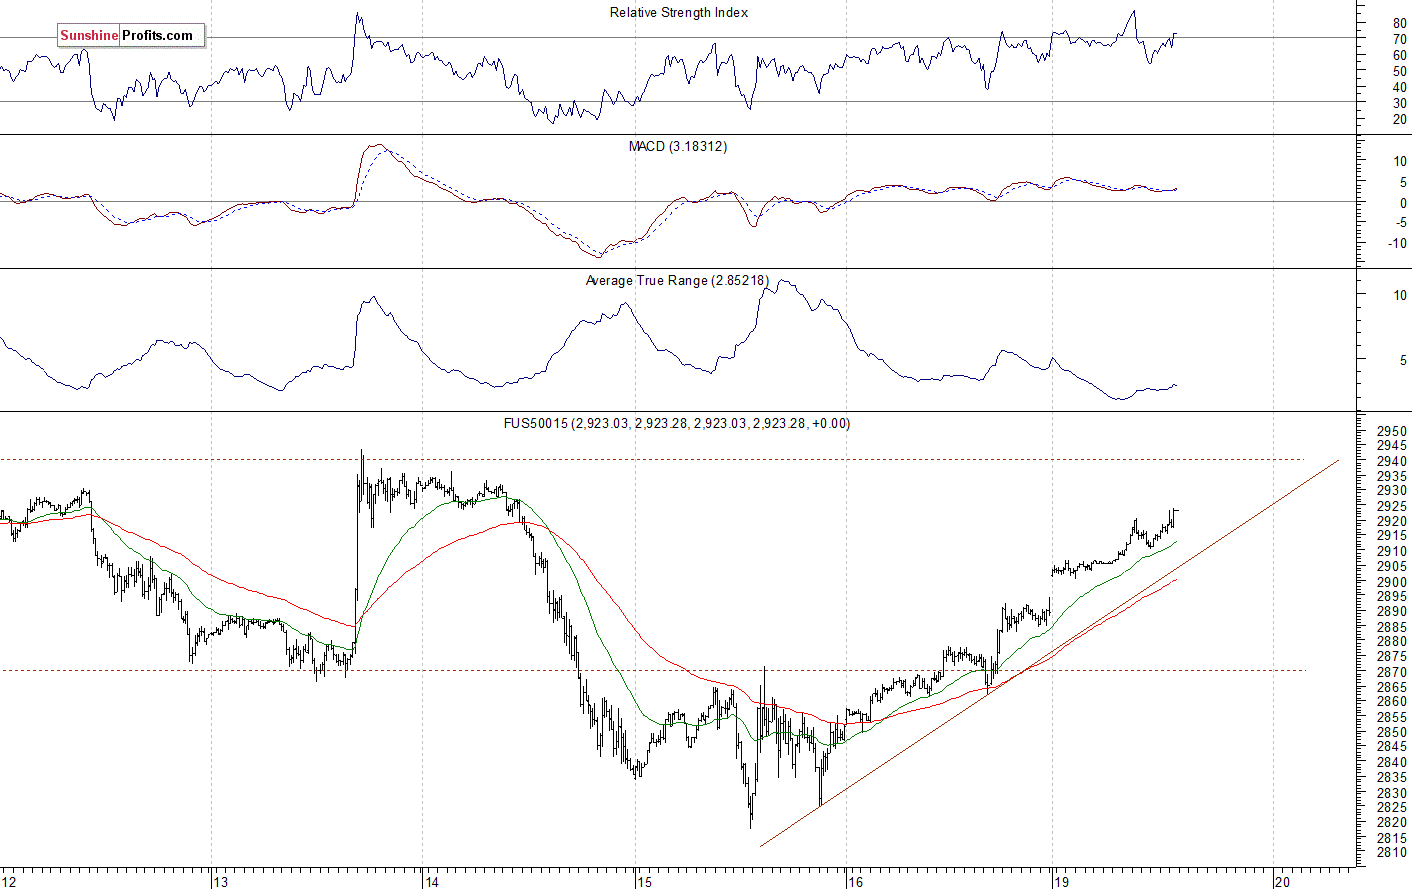
The S&P 500 futures contract trades within an intraday uptrend, as it extends its late last week rally. The nearest important resistance level is at 2,930-2,940, marked by the short-term local highs. On the other hand, the support level is at 2,895-2,900, among others. The futures contract gets closer to its last week’s high, as the 15-minute chart shows:

Nasdaq 100 Close to 7,700
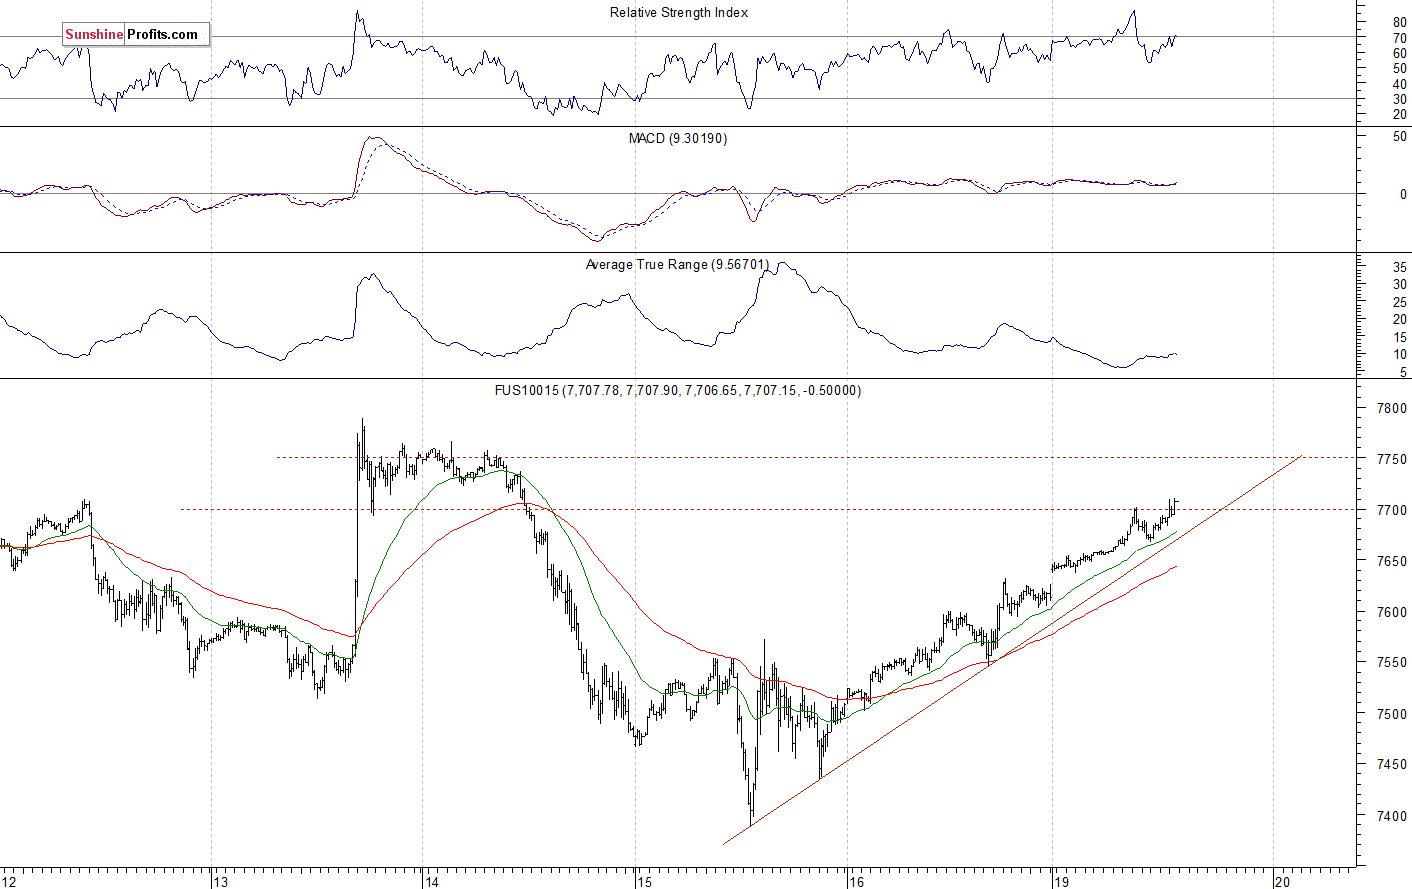
The technology Nasdaq 100 futures contract follows a similar path, as it trades within an intraday uptrend. It bounced off support level of 7,350-7,400 on Thursday. The nearest important resistance level is now at 7,700-7,750. The Nasdaq futures contract remains above the short-term upward trend line, as we can see on the 15-minute chart:

Big Cap Tech Stocks Remain at Resistance Levels
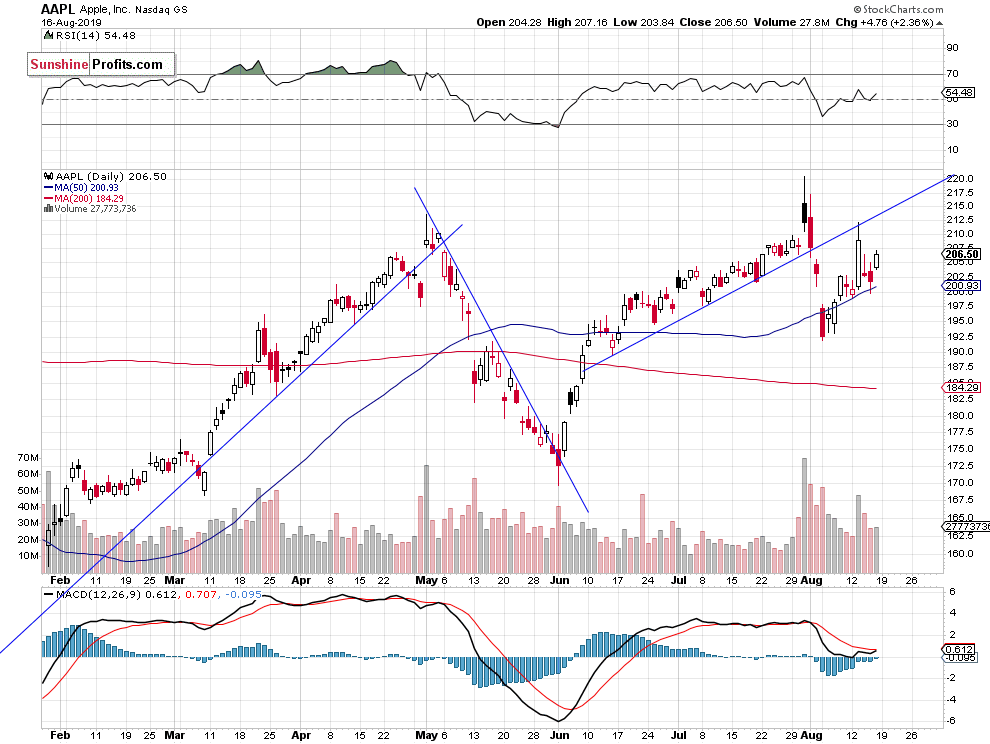
Let’s take a look at the Apple, Inc. stock (AAPL) daily chart (chart courtesy of http://stockcharts.com). The stock retraced most of the recent decline last week, as it got back to the broken upward trend line. But then it reversed off the resistance level of $210-215. The stock remains close to that resistance level. We could see another attempt at breaking higher:

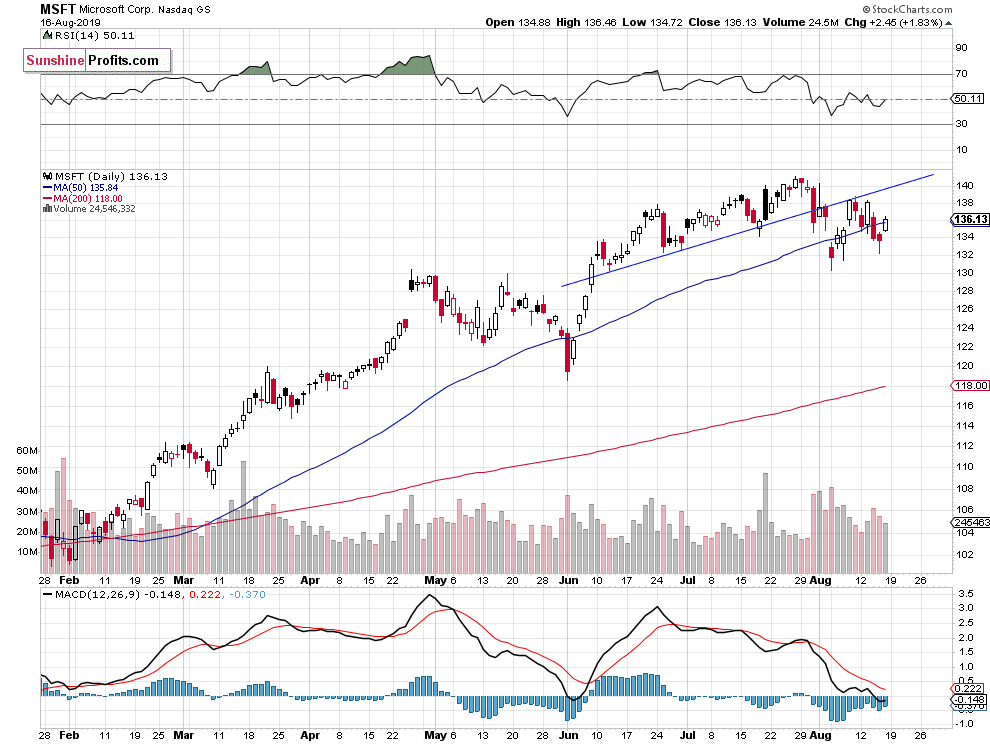
Now let’s take a look at the daily chart of Microsoft Corp. stock (MSFT). The stock remains below the broken upward trend line. The resistance level is still at $140-145. For now, it looks like a consolidation within a medium-term uptrend:

Dow Jones Extending Consolidation
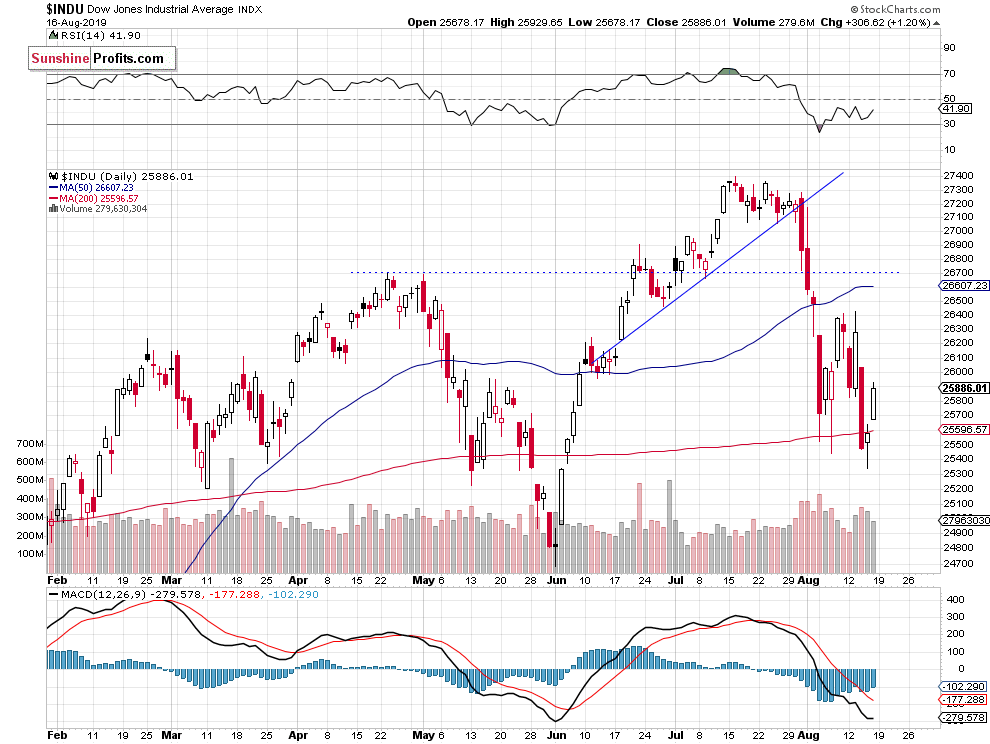
The Dow Jones Industrial Average broke below its upward trend line in late July. Then it fell to around 25,500, before bouncing off the 200-day moving average. Last week the blue-chip stocks’ gauge got back lower and it broke slightly below that average. But then it bounced off that support level again. We could see more short-term fluctuations following the mentioned late July – early August sell-off:

Nikkei Remains Close to 20,500
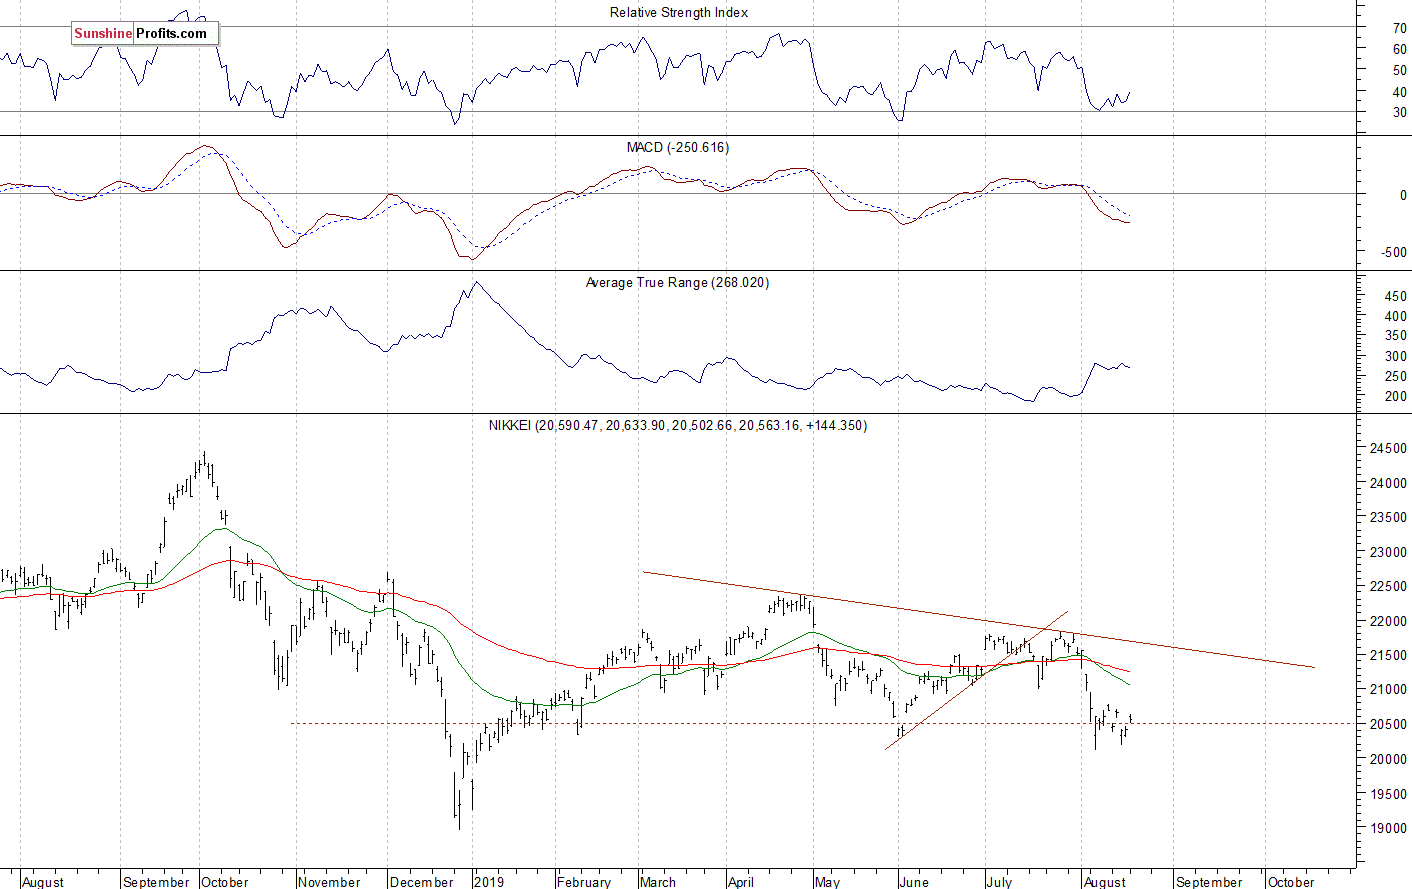
Let’s take a look at the Japanese Nikkei 225 index. It broke below an over month-long upward trend line in July. Then it fell slightly below the 20,500 mark again. The market continues to trade along the previous medium-term lows:

The S&P 500 index broke below the upward trend line in late July, as investors reacted to the Fed’s Rate Decision release, among other factors. We saw technical overbought conditions along with negative technical divergences then. And the market declined following renewed trade war fears. Recently it was rebounding off the support level of around 2,800-2,820. Has the bottom been reached? For now, it looks like a consolidation following the decline.
Concluding, the S&P 500 index will likely open higher again today. The market may retrace more of its recent sell-off. If the index breaks above its last week’s high, we could see more buying pressure.
If you enjoyed the above analysis and would like to receive free follow-ups, we encourage you to sign up for our daily newsletter – it’s free and if you don’t like it, you can unsubscribe with just 2 clicks. If you sign up today, you’ll also get 7 days of free access to our premium daily Gold & Silver Trading Alerts. Sign up today!
Thank you.
Paul Rejczak
Stock Trading StrategistSunshine Profits – Effective Investments through Diligence and Care
THIS ARTICLE ORIGINALLY POSTED HERE.


")
 – David Skarica")