
After the earlier upswing, the euro has headed south again. Will the bears be strong enough to break below the support this time? How could we play the unfolding move? Let’s take a look at the profitable opportunity we deem well worth jumping upon immediately.
EUR/USD – Breaking Down or Just Resting at Support?

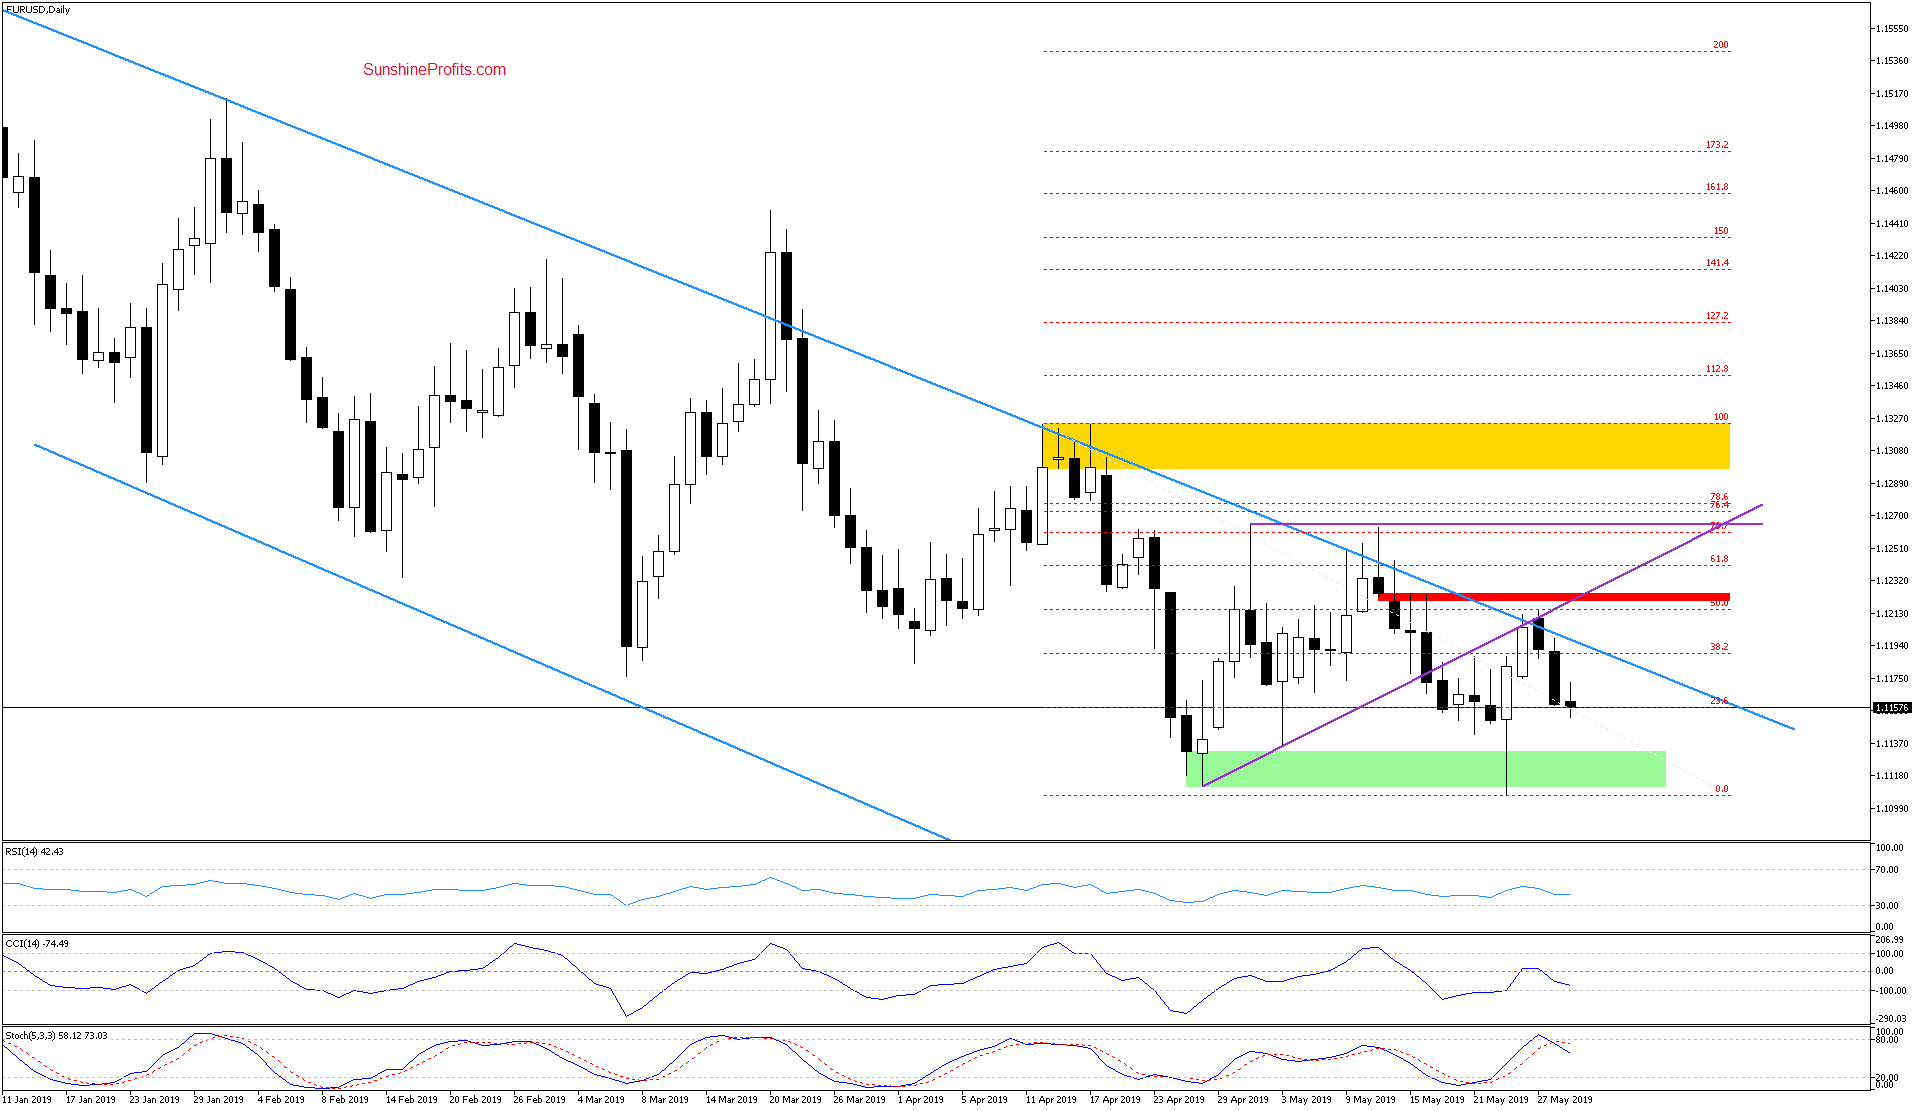
We wrote yesterday that:
(…) the pair has invalidated the earlier tiny breakout above the purple line and also a small move above the upper border of the blue declining trend channel. This doesn’t bode well for higher EUR/USD values ahead.
Earlier today, the rate revisited Friday’s lows and we also see the Stochastic Oscillator in its overbought area and close to generating a sell signal.
Connecting the dots, further deterioration seems to be just around the corner.
The pair went on to close yesterday’s session near the daily lows which happen to be also below the Friday’s low. Just as expected, the Stochastic Oscillator generated its sell signal, increasing the probability of further deterioration.
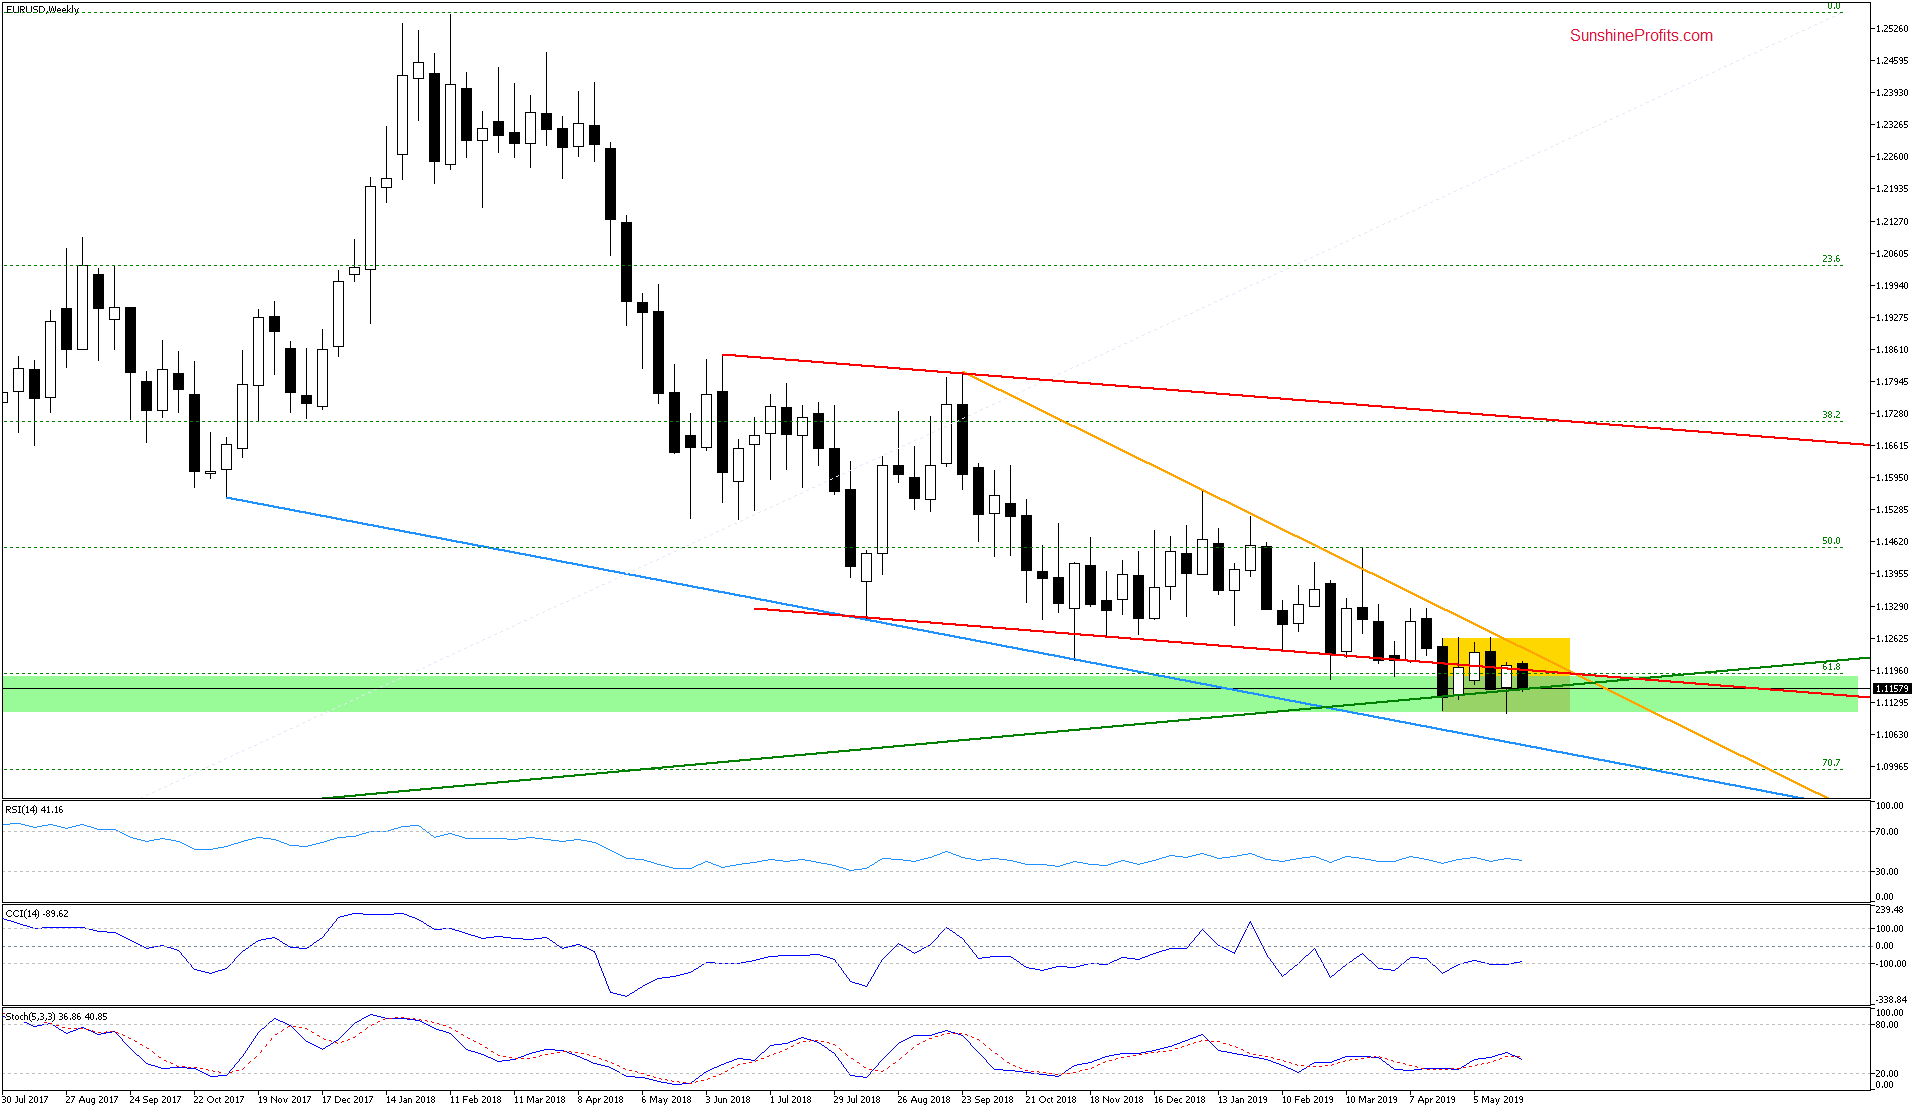
Let’s take a look now how the short-term changes reflect on the medium-term picture.

The weekly chart shows that the pair is currently resting at the long-term rising green support line that was strong enough to stop the bears several times in a row already.
Even if the pair extends loses from current levels, a sizable and sustainable move to the downside remains questionable until we see a weekly close below this support together with a breakdown below the lower border of the yellow consolidation.
In the short term, we can however still see a test of the green support zone as marked on the daily chart in the very near future. Therefore, opening short positions to take advantage of such a short-term downswing seems justified.
GBP/USD – Trainwreck in Slow Motion?

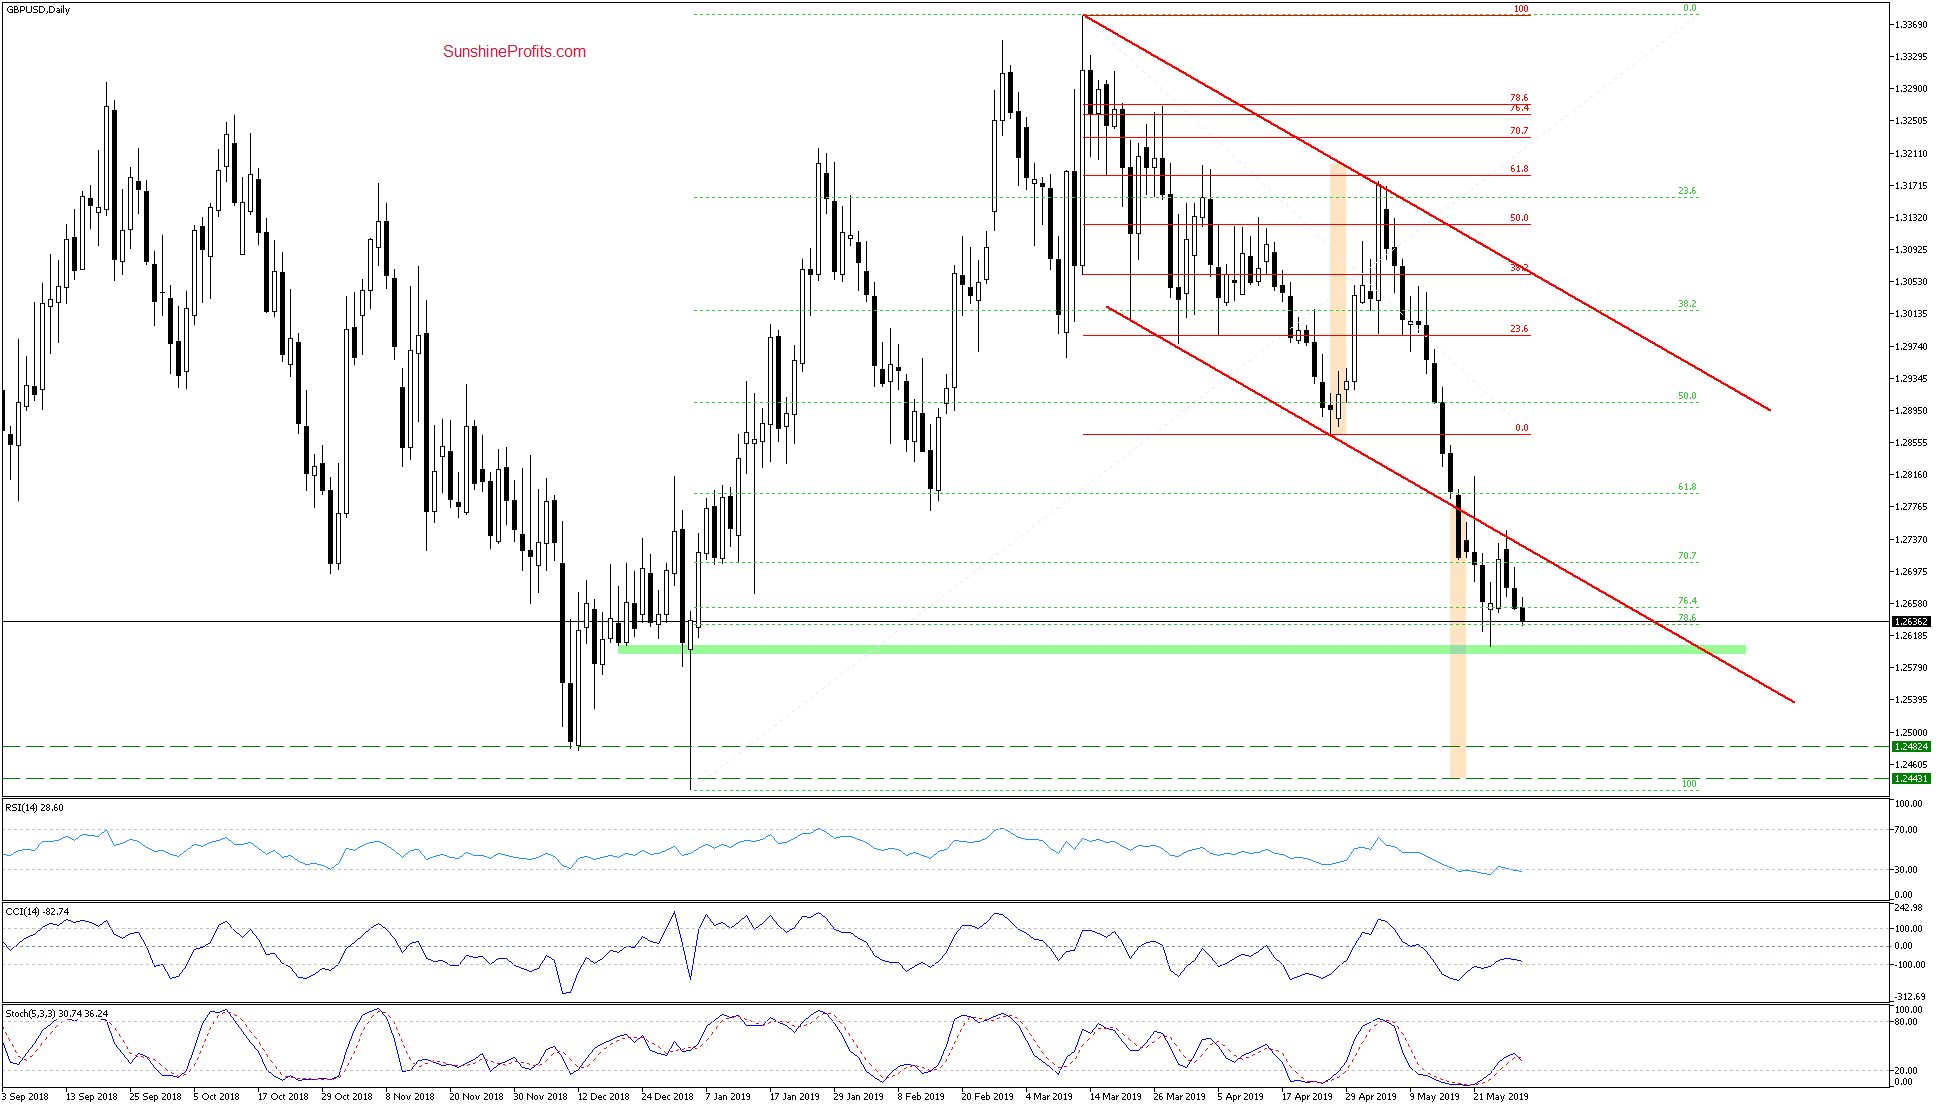
The most prominent upswing of recent weeks is the late April one. It has touched the 61.8% Fibonacci retracement (marked in red) and the upper border of the declining red trend channel only to powerfully reverse lower next.
The pair went on to test and break below the lower border of the declining red trend channel shortly. At the start of both the previous and the current week, the rate has attempted a comeback to the declining red trend channel. Unsuccessfully, as the following price action went on to take the pair lower.
As a result, both recent upswing attempts look like a verification of the breakdown below the lower border of the declining red trend channel. Currently, the pair sits at the support area created by the 76.4% and 78.6% Fibonacci retracements (marked in green).
A further move lower is supported by the sell signal of the Stochastic Oscillator. This increases the likelihood of a test of the recent lows in the very near future. But could the pair fall even lower?
Take a look at the yellow vertical rectangles. One marks the width of the red trend channel the rate has broken down from. The corresponding target would be at the lower end of the right yellow rectangle, where the late December 2018 lows are (at around 1.2443). But first, the bears have to push the rate below last week’s lows.
AUD/USD – Does the Upswing Still Have Legs?

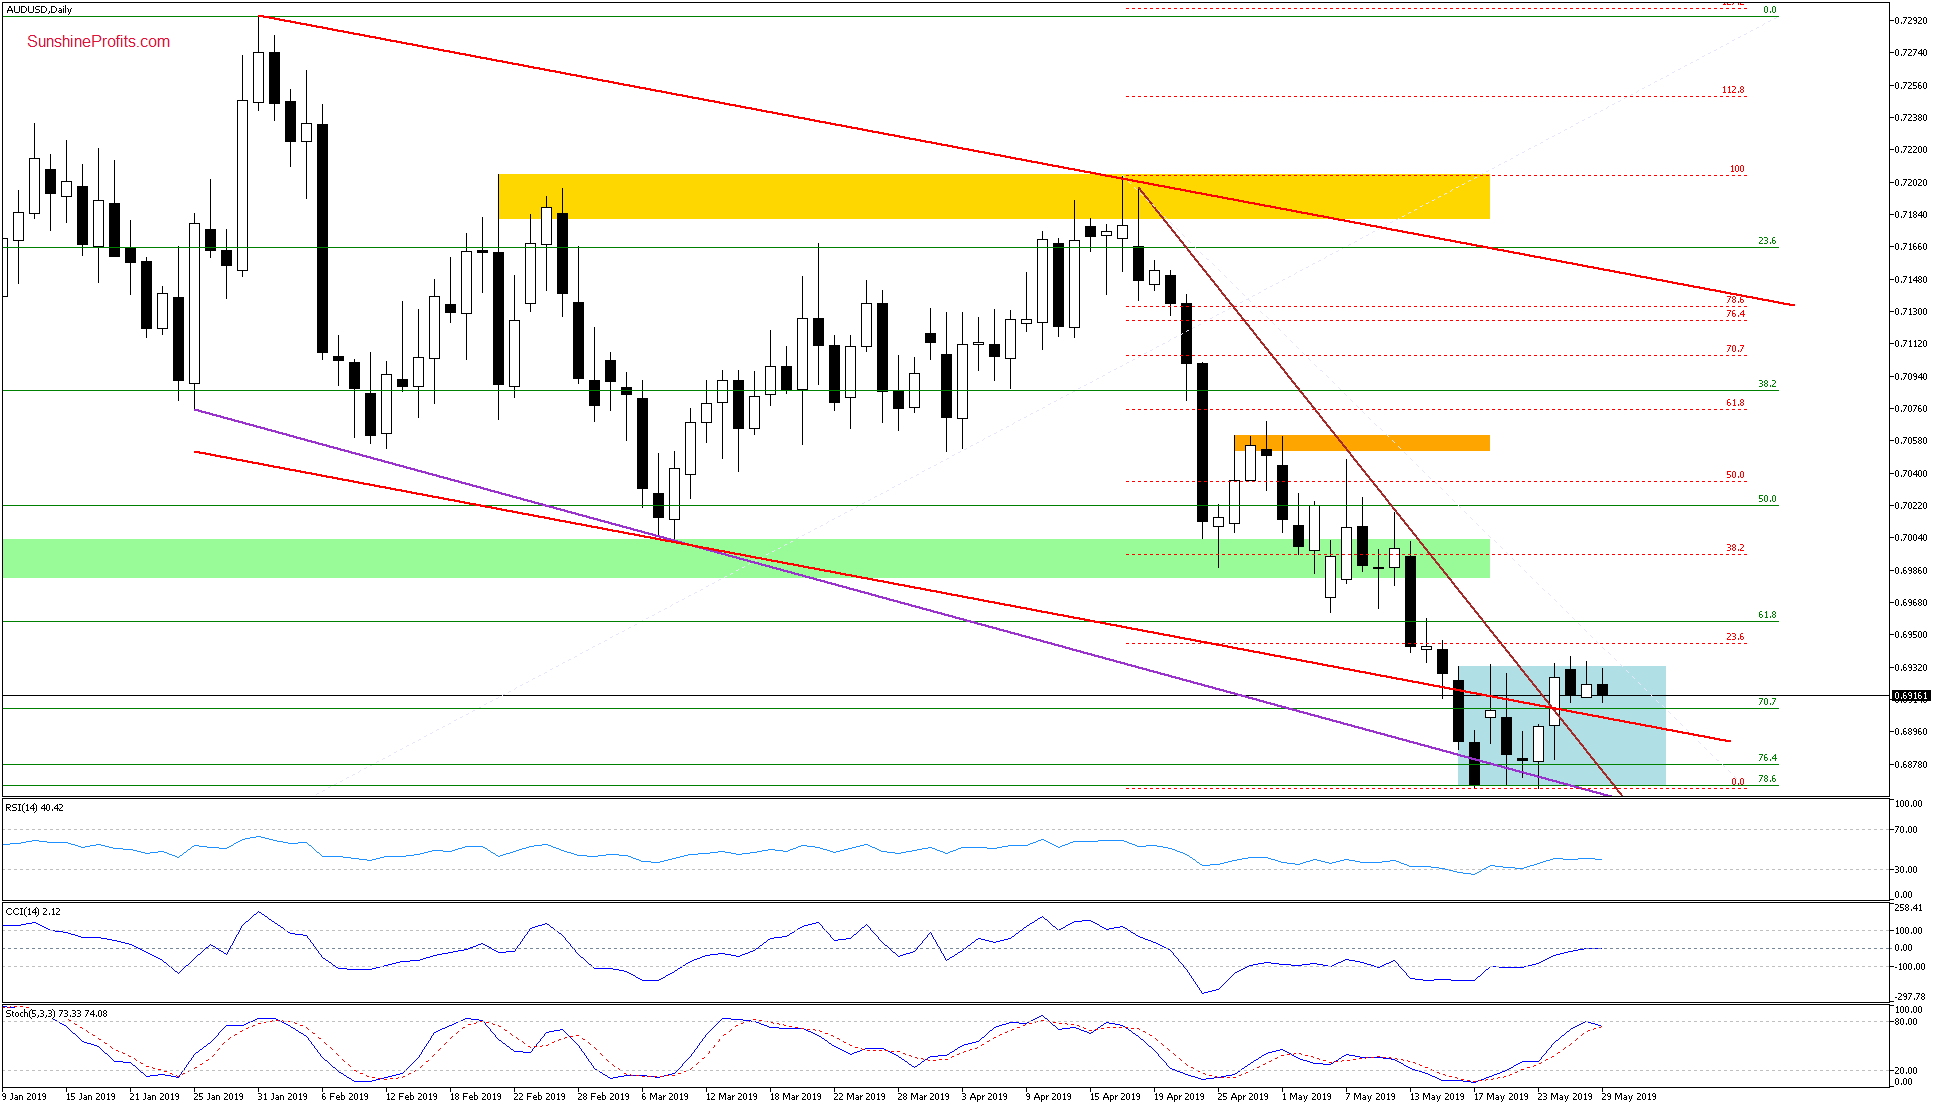
The daily chart reveals that AUD/USD has climbed above both the lower border of the declining red trend channel and the declining brown trend line. While the former marks an invalidation of the earlier breakdown, the latter hints at the increasing probability of further price improvements.
Currently, the pair trades sideways inside the blue consolidation and the upper knots of recent candles point to a potentially waning power of the bulls. Indeed, the Stochastic Oscillator is in its overbought area, looking to be on the verge of generating a sell signal in a few days. This constellation doesn’t bode well for a further rally.
If the bulls don’t succeed in breaking out from the blue consolidation to the upside, we’re likely to see a test of the lower border of the declining red trend channel as a minimum. Even a decline to the steeply-descending brown resistance-turned-support line or the lower border of the blue consolidation isn’t out of the question in the coming days.
Summing up the Alert, EUR/USD has shown the desired weakness (breakdown below Friday’s lows and daily Stochastics on a sell signal) that allows us to open a short position targeting the green support zone initially. USD/CAD is again testing the strong combination of resistances that have sent it lower many times earlier already. Our short position remains justified as there hasn’t been any breakout, let alone a verified one. There’re no other opportunities worth acting upon in the currencies right now. As always, we’ll keep you – our subscribers – informed.
If you enjoyed the above analysis and would like to receive free follow-ups, we encourage you to sign up for our daily newsletter – it’s free and if you don’t like it, you can unsubscribe with just 2 clicks. If you sign up today, you’ll also get 7 days of free access to our premium daily Oil Trading Alerts as well as Gold & Silver Trading Alerts. Sign up now!
Thank you.
Nadia Simmons
Forex & Oil Trading Strategist
Sunshine Profits – Effective Investments through Diligence and Care.
THIS ARTICLE ORIGINALLY POSTED HERE.


")
 – David Skarica")