
Today, I want to give you an overview of my updated views on the markets and also take a look at some good stocks in position for a good entry point.
1)I started to get bearish on the markets in the summer of 2021, because the internals of the markets turned down to form a negative divergence with the market averages, which continued to go higher. This has historically been a prelude to a 20% or more correction in the markets or a bear market.
We got the latter in 2022.
My favorite way to look at the internals is by monitoring the percentage of stocks on the NYSE above and below their 200-day moving averages.

You can see how the internals went down in 2021 while the stock market went up.
However, those internals turned up in the last two months of 2022. I noticed that in January and took that as the sign that the bear market of 2022 was over. This was a clear indication that the stock market rally that began in October was not the type of bear market rally like all the ones that came before it that year that ended in failure that took the market to new lows. In my view, we were actually starting to see the start of a cyclical (1-3 year) bull market within a long-term secular bear market (7-10+ year plus sideways market).
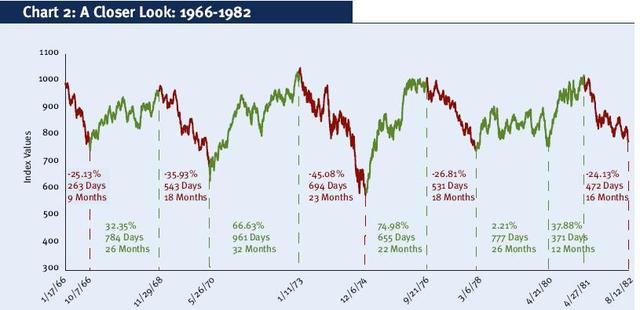
A secular bear market is like what happened from 2000-2012 for the Nasdaq or from 1966-1982 with the secular bear market for the DOW. The DOW peaked in 1966 and did not make a meaningful new high for 17 years. Those years were dominated by high inflation. The inflation started in 1967, but became entrenched in the 1970’s and turned the economy into “stagflation.” This chart shows you the type of cyclical cycles that took place during that long secular bear market.
We are not going back to the way things were before 2022. So many small traders and investors expect to make huge returns year after year as that is what they saw the markets do from 2016-2020 and many who got started in trading in 2020 think that the hype of meme stocks and crypto is real and believe they are supposed to get big gains from app trading. That’s what they saw people tell them on social media to get the clicks and attention and so they believed it.
What is different now is inflation and interest rates. Zero interest rate policies helped fuel bubble moves in the financial markets, but those policies ended after the Federal Reserve took interest rates to zero. Now 10-year Treausury bond yields are nearing 5% and are never going to zero ever again.

2)S&P 500 outlook.
Financial commentators always say the economy and the markets are uncertain. But what is happening is pretty obvious if you step back and stop focusing on day to day gyrations. Keep your eyes on the 200-day moving averages. When the market trades above them and they act as support you are in a bull market and when the averages trade below them, as they did last year, you are in a bear market. This is called simple stage analysis and I write about it in my book Strategic Stock Trading.

When the internals improved in the markets they soon generated a “breadth thrust” expansion in January, which historically has ALMOST ALWAYS led to an overall gain in the markets 12 months later. They typically launch the start of cyclical bull markets. Old school technician Walter Deemer did a post that got passed around all over the place laying it out, but many still did not believe his analysis and when the market dipped in February many started to fear that a big collapse was coming. Yields were ticking up again, they pointed out.
Some called his “breadth thrust” signal “breakaway momentum.”
How is 10-day thrust holding up? Near the low end of the historic range, according to this great study from @twillo1 pic.twitter.com/Hau20F5lgp
— Mark Ungewitter (@mark_ungewitter) February 24, 2023
After the first short-term rally ends, a few weeks after this signal, on average the S&P 500 pulls back 4.5%.
The SPX declined 6.9% from its Feb 2 intraday high to Thursday's intraday low. This is more than almost all of the previous post-Breakaway Momentum corrections, so given Friday's bullish outside day Thursday's low of 3928 has become a very significant level.
— Walter Deemer (@WalterDeemer) March 4, 2023
All financial markets put on a decent rally day on Friday and have now put in what look like higher lows for the year. Take a look at the chart of the S&P 500, for instance.

So, the S&P 500 rallied up to 4200 and dipped in February back down to the 3900 area and its 150 and 200-day moving averages to rally on Friday. If the market is bullish and in a cyclical bull market than you now have a good entry point for your favorite ETF’s or stocks. You could just buy and put a stop loss order on the February low and see what happens. If you don’t get stopped out just hold till the end of the year.
Note that the daily stochastics gave a buy signal on Friday. The last buy signal came at the end of January when they crossed back above 20.
Again – I believe we are in a cyclical bull market, that is likely to last through this year and probably into the next Presidential election. However, that does’t mean huge upside.
I’m targeting a move back up to highs of the S&P 500 (18% from here) and after that the market may do nothing but go sideways for a year or more. That would be typical of the price action in a cyclical bull market within a secular bear. In such an environment getting dividends are important for those times that the market is going sideways and being diversified is critically important to control risks. It makes no sense to take giant risks when market returns aren’t likely to be big over the next few years.
Margin maniacs now will pay huge interest for their high risk gambles too.
3)The uncertainty they keep talking about….
So many don’t want to look at charts and indicators and say things are too uncertain in the economy to do anything. The economists typically failed at predicting what the economy will exactly do (they told us inflaton would be “transitory” in 2021) and the further out the predictions are the harder they are to make, but we are not having a recession collapse right now. We are having what is stagflation – which does generate low GDP growth – and there is no reason to think it can’t continue like this for the rest of this year.
According to the Federal Reserve live forecasts they are looking at GDP growth of 2.3% in the first quarter.
The Cleveland Federal Reserve at the moment is projecting very little change in the inflation report for February, but a drop in annualized CPI down to 5.38% by the end of this month. If that happens it will be portrayed as a victory by pundits and Fed officials when it gets reported in April as it will mean they are one rate hike away to getting the Fed Funds rate above the annualized CPI rate by the May Federal Reserve meeting.
That would be a bullish catalyst for stocks if you are looking for a reason for the stock market to go up in the “uncertain” times.
4)The best sectors for the US stock market.
Year to date, the best sector in the US stock market has been the semiconductor sector. Most of the popular fad tech stocks, like META, TSLA, GOOG, AMZN, and so forth, are continuing to lag the S&P 500. Bank stocks, industrials, REIT’s, and consumer stocks are likely to outperform those fad stocks. Let’s look at the SMH semiconductor ETF today.

The SMH/SPX relative strength ratio has been rising since October to show us that this ETF has been outperforming the S&P 500 and has been a leading sector in the market. I currently own semiconductor stock NVDA.

The US dollar peaked last year and I believe is in a new cyclical bear market. This is helping foreign markets outperform the US stock market too. I own a bunch of foreign market ETF’s, with EWG being my biggest holding in them.
A foreign semiconductor stock I own is UMC.

Casinos also have been among the top performing sectors of the US stock market since October too. A casino stock I own in a good buying position now is CZR.

3)Germany….
The best foreign market ETF I own now is EWG for Germany.

4)Commodities….
I own gold, silver, and mining stocks, as you already know if you have been following my work. It looks like the DBA agriculture ETF is now getting ready to turn up again.

Although I don’t own this ETF at the moment, I do own several agriculture and fertilizer stocks that typically do well when DBA rises. For instance, I own MOS.

As for gold and silver, I own a position in the CEF ETF, which owns both.

The February low is the current price support point for this ETF.
Let’s see how things play out this week.
To get my free stock trading updates click here.
-Mike


 – David Skarica")