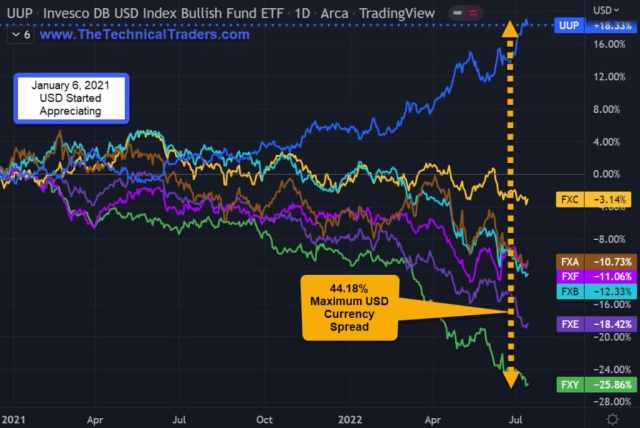
The U.S. Dollar uptrend has been going on since January 6th, 2021:
- U.S. Dollar is at a 14-year high
- 2020-2022 U.S. Presidential Cycle: USD appreciated +18.33% to date
- 2016-2020 U.S. Presidential Cycle: USD depreciated – 12.80%
- 2012-2016 U.S. Presidential Cycle: USD appreciated +37.20%
International investors interested in buying U.S. real estate are having issues as converting their country’s currency into the USD significantly reduces the amount of real estate they can purchase.
According to an article by Patrick Clark of Bloomberg on July 11, 2022, “Across the country, nearly 60,000 homes sales fell through according to an analysis by Redfin Corp.” “That was equal to 15% of transactions that went into a contract that month, the highest share of cancellations since April 2020, when early Covid lockdowns froze the housing market.”
Redfin NASDAQ RDFN, which offers a full-service real estate brokerage discounted service, has suffered a staggering loss of -92.80% in its stock price after putting in its February 2021 high.
D.R. Horton NYSE DHI, America’s largest homebuilder as of January 20, 2022, responsible for 71,292 home closings totaling $21.5 billion in revenue for 2021, has dropped -46.44% from its high.
Other housing-related commodity markets such as copper -38.09% and lumber -70.24% are also signaling a recession.
U.S. DOLLAR +18.33%
- UUP +18.33% U.S. Dollar ETF
- FXC -3.14% Canadian Dollar ETF; Spread CAD to the USD 21.47%
- FXA -10.73% Australian Dollar ETF; Spread AUD to the USD 29.06%
- FXF -11.06% Swiss Franc ETF; Spread CHF to the USD 29.39%
- FXB -12.33% British Pound ETF; Spread GBP to the USD 30.66%
- FXE -18.42% Eurodollar ETF; Spread EUD to the USD 36.75%
- FXY -25.86% Japanese Yen ETF; Spread JPY to the USD 44.18%
INVESCO DB USD INDEX BULLISH FUND ETF • UUP • ARCA • DAILY

REDFIN -92.80%
- February 2021 to present
- -$91.84 per share or -92.80%
- 68 weeks down; 476 days down
REDFIN CORPORATION • RDFN • NASDAQ • WEEKLY

DR HORTON -46.44%
- December 2021 to present
- -$51.42 per share or -46.44%
- 26 weeks down; 182 days down
D.R. HORTON INC. • DHI • NYSE • WEEKLY

COPPER -38.09%
- March 2022 to present
- -$1.91 per pound or -38.09%
- 18 weeks down; 126 days down
CFDS ON COPPER (US$/LB) • XCUUSD • OANDA • WEEKLY

LUMBER -70.24%
- May 2021 to present
- -$1218.50 per board foot or -70.24%
- 57 weeks down; 399 days down
RANDOM LENGTH LUMBER FUTURES (US$/BOARD FOOT) • LBS1 • CME • WEEKLY

VALUABLE INSIGHTS FROM SUCCESSFUL TRADERS
The New Market Wizards by Jack D Schwager (www.Amazon.com) is packed with insights from successful traders who have shared their wisdom based on firsthand trading experiences. The following snippets are from his super trader interviews that seem relevant for today’s market:
Randy McKay:
- “I realized that prices moved based on the psychology of the people who were trading.” “You could actually see anxiety, greed, and fear in the markets.”
- “I never try to buy a bottom or sell a top.” “You don’t want to have a position before a move has started.” “You want to wait until the move is already underway before you get into the market.”
- “When I get hurt in the market, I get the hell out.” “It doesn’t matter at all where the market is trading.” “I just get out, because I believe that once you’re hurt in the market, your decisions are going to be far less objective than they are when you’re doing well.” “If you stick around when the market is severely against you, sooner or later they’re going to carry you out.”
- “I basically learned that you must get out of your losses immediately.” It’s not merely a matter of how much you can afford to risk on a given trade, but you also have to consider how many potential future winners you might miss because of the effect of the larger loss on your mental attitude and trading size.”
LEARN FROM OUR TEAM OF SEASONED TRADERS
In today’s market environment, it’s imperative to assess our trading plans, portfolio holdings, and cash reserves. As professional technical traders, we always follow the price. At first glance, this seems very straightforward and simple. But emotions can interfere with a trader’s success when they buck the trend (price). Remember, our ego aside, protecting our hard-earned capital is essential to our survival and success.
Successfully managing our drawdowns ensures our trading success. The larger the loss, the more difficult it will be to make up. Consider the following:
- A loss of 10% requires an 11% gain to recover.
- A 50% loss requires a 100% gain to recover.
- A 60% loss requires an even more daunting 150% gain to simply break even.
Recovery time also varies significantly depending upon the magnitude of the drawdown:
- A 10% drawdown can typically be recovered in weeks to a few months.
- A 50% drawdown may take many years to recover.
Depending on a trader’s age, they may not have the time to wait nor the patience for a market recovery. Successful traders know it’s critical to keep drawdowns with reason, as most have learned this principle the hard way.
Sign up for my free trading newsletter so you don’t miss the next opportunity!
We invite you to join our group of active traders who invest conservatively together. They learn and profit from our three ETF Technical Trading Strategies. We can help you protect and grow your wealth in any type of market condition. Click on the following link to learn how: www.TheTechnicalTraders.com.
Chris Vermeulen
Founder & Chief Market Strategist
TheTechnicalTraders.com


