
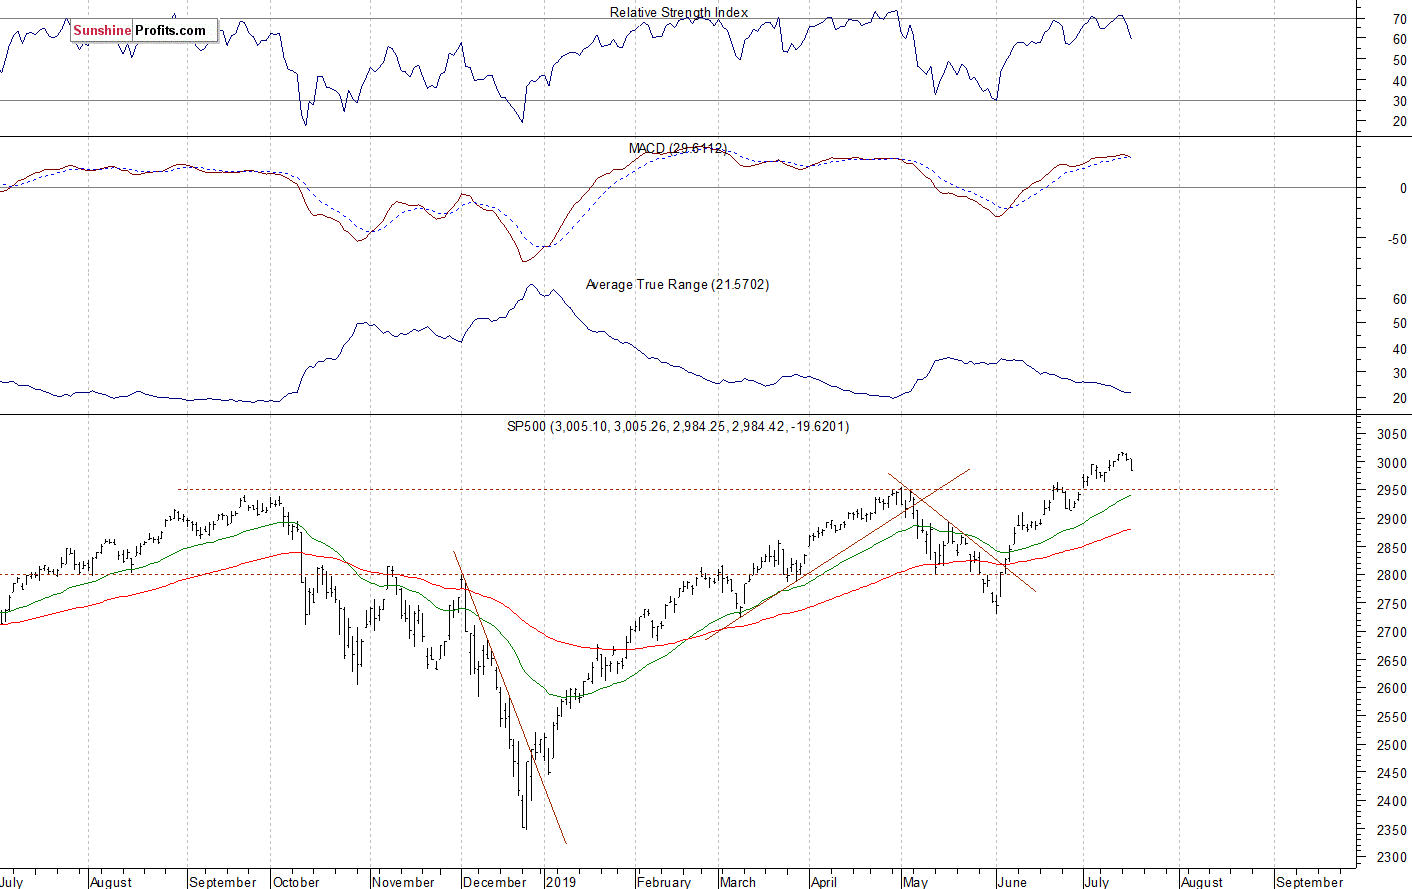
The U.S. stock market indexes lost 0.4-0.7% on Wednesday, as investors took more short-term profits off the table following the recent record-breaking advance. The S&P 500 index reached the new record high of 3,017.80 on Monday. It gained around 290 points from its early June local low of 2,728.81. Yesterday it got back below the 3,000 mark. The Dow Jones Industrial Average lost 0.4% and the Nasdaq Composite lost 0.5% on Wednesday.
The nearest important resistance level of the S&P 500 index is now at 3,000, marked by the recent support level. The next resistance level is at around 3,015-3,020, marked by the record high. On the other hand, the support level is at 2,980-2,985, marked by last week’s Wednesday’s daily gap up of 2.981.90-2,984.62. The next support level is at 2,965-2,970, marked by the early July local lows.
The broad stock market broke above its short-term consolidation recently and it broke above the 3,000 mark. Is this a real bullish breakout above the last year’s September-October topping pattern? The S&P 500 extended its half-year-long run-up:

S&P 500 Back Below 3,000 Mark
The index futures contracts trade 0.1-0.2% below their Wednesday’s closing prices, so expectations before the opening of today’s trading session are slightly negative. The European stock market indexes have been mixed so far. Investors will wait for some economic data announcements today: Philly Fed Manufacturing Index, Unemployment Claims at 8:30 a.m., CB Leading Index at 10:00 a.m. They will also wait for the quarterly corporate earnings releases.
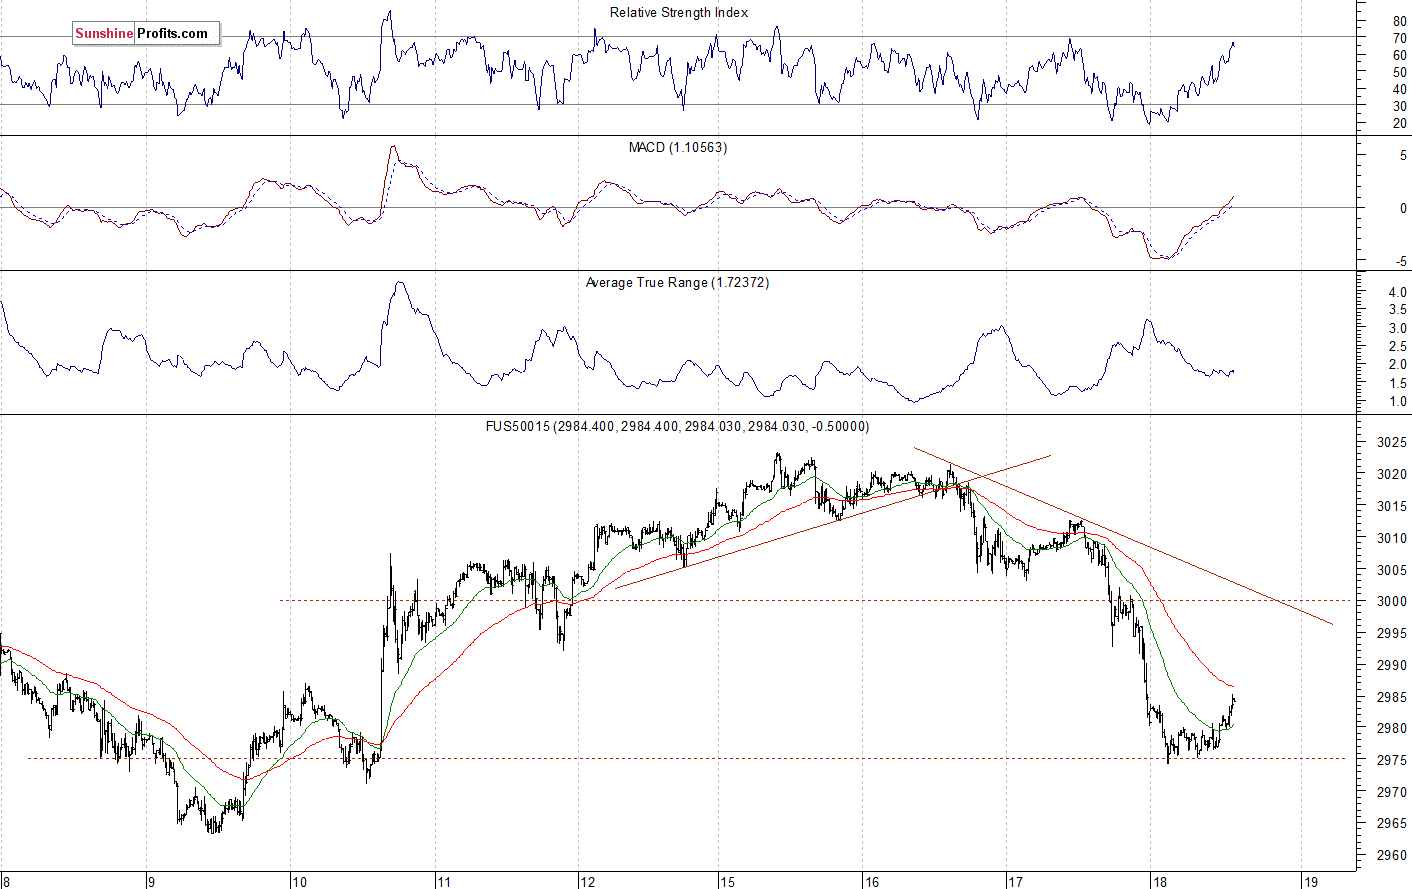
The S&P 500 futures contract trades within an intraday uptrend, as it retraces some of an overnight decline. The nearest important resistance level is at 2,990-3,000. On the other hand, the support level is at 2,970-2,975. The futures contract is at its previous short-term consolidation this morning, as we can see on the 15-minute chart:

Nasdaq Also Lower
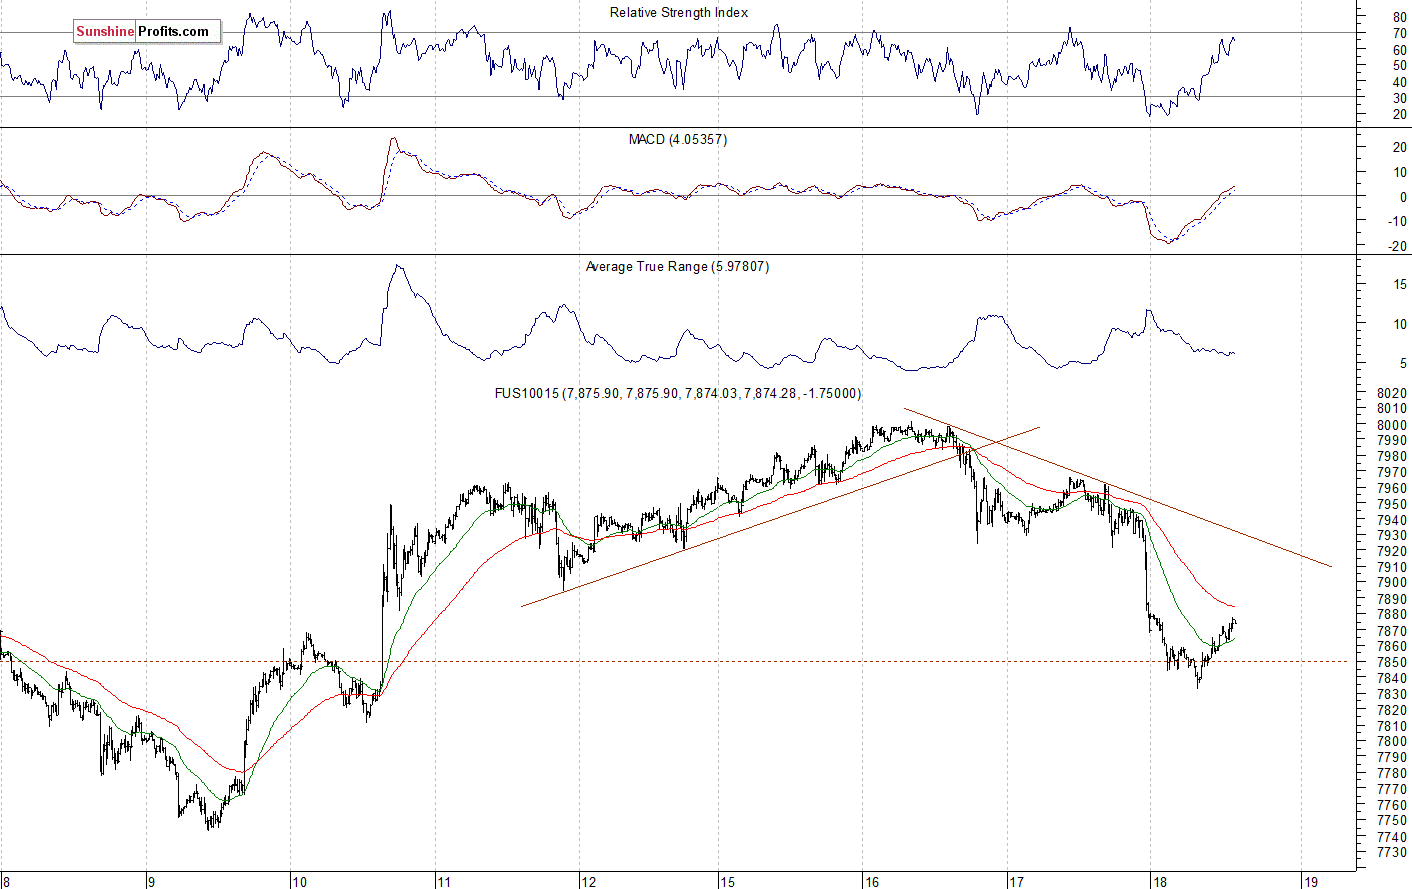
The technology Nasdaq 100 futures contract follows a similar path, as it trades within an intraday uptrend following yesterday’s decline. It bounced off the 8,000 mark on Tuesday. The support level is now at 7,800-7,850. The Nasdaq futures contract is below its two-day-long downward trend line, as the 15-minute chart shows:
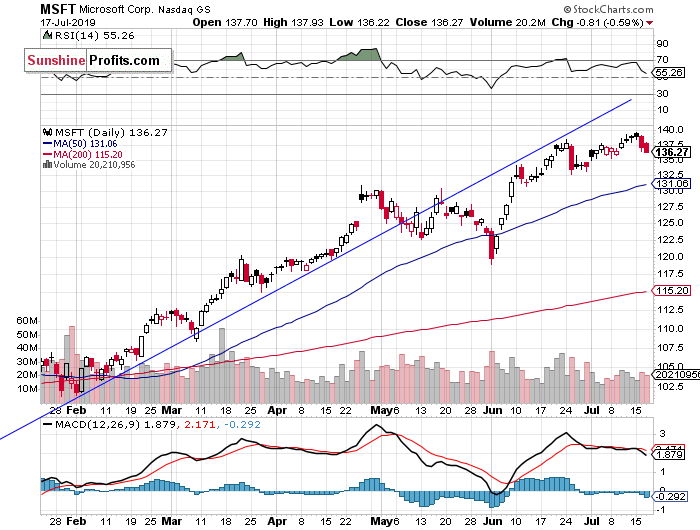
Apple Going Sideways, Microsoft Weaker Ahead of Earnings Release
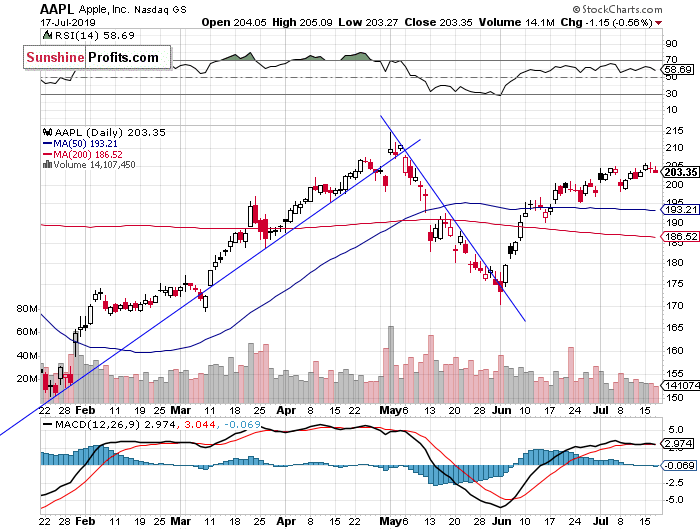
Let’s take a look at the Apple, Inc. stock (AAPL) daily chart (chart courtesy of http://stockcharts.com). The stock broke slightly above the resistance level of $200 recently. Then we saw a short-term consolidation, as the market fluctuated below the early May local highs. The resistance level remains at $210-215, and the support level is at $195-200:

Now let’s take a look at the daily chart of Microsoft Corp. stock (MSFT). The stock retraced some of its recent advance, as it bounced off the Monday’s new record high of $139.54. Investors will wait for today’s after-hours’ quarterly earnings release from Microsoft. The stock may extend its month-long consolidation along the price of $135:

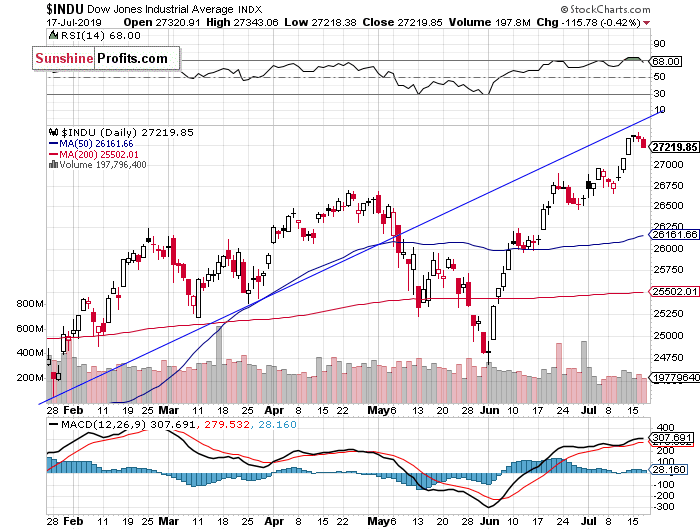
Dow Jones’ Correction
The Dow Jones Industrial Average reached the new record high of 27,398.68 on Tuesday. Then it retraced some of the recent rally. For now, it looks like a downward correction. However, we still can see technical overbought conditions:

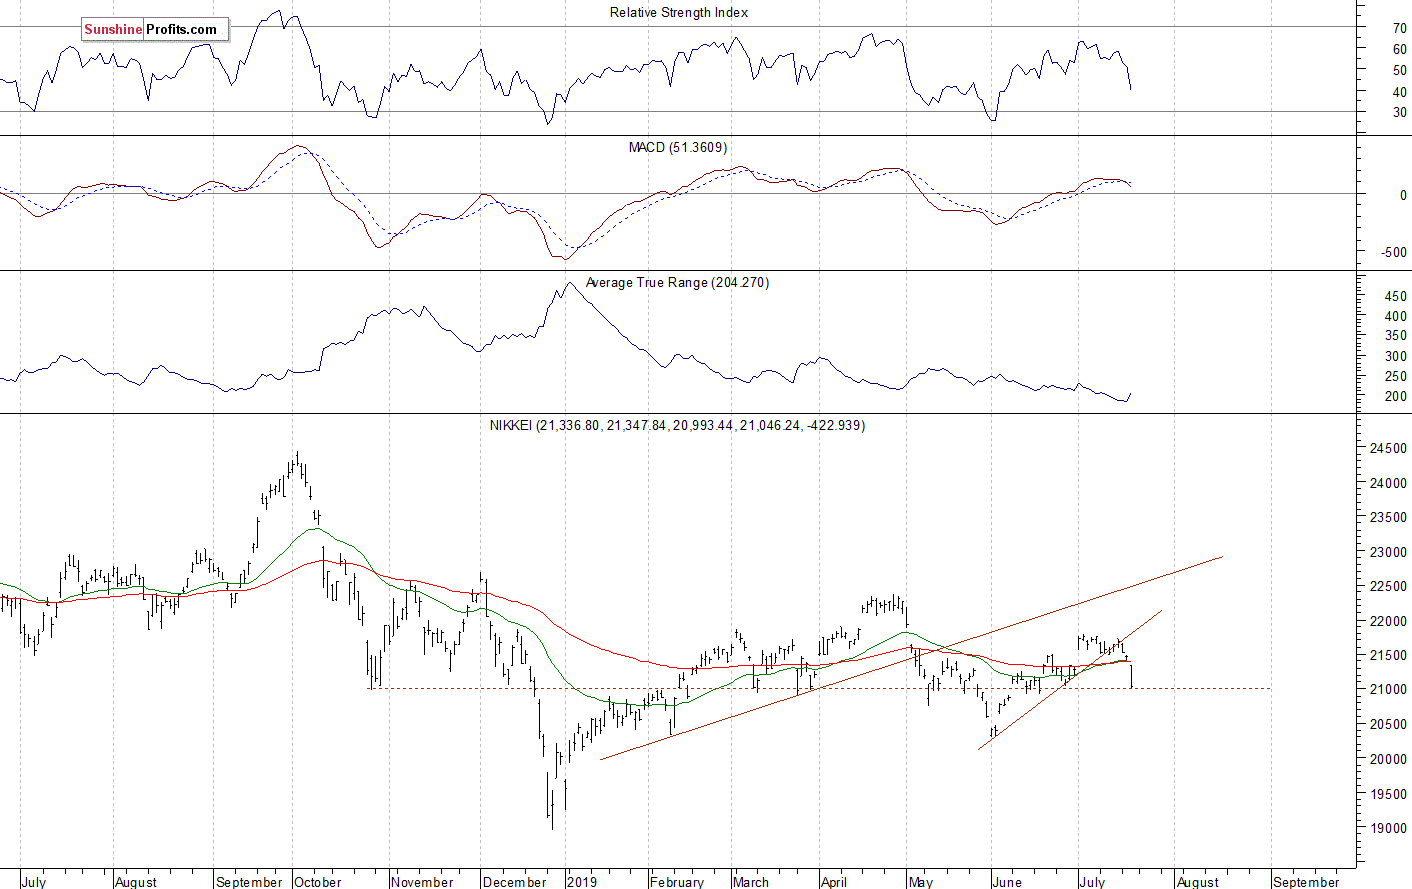
Nikkei Breaking Lower
Let’s take a look at the Japanese Nikkei 225 index. It broke below the over month-long upward trend line early this week and today it accelerated lower. It is at the 21,000 mark again:

The S&P 500 index reached the new record high on Monday, as investors’ sentiment remained bullish following the recent advances. But yesterday’s trading session was bearish, as investors took profits off the table. The index got back below the 3,000 mark again. For now, it looks like a downward correction. We could see some more sideways trading action, as investors react to quarterly corporate earnings releases.
Concluding, the S&P 500 index will likely open slightly lower today. We could see more short-term fluctuations along the 3,000 mark. Investors will wait for the quarterly earnings releases.
If you enjoyed the above analysis and would like to receive free follow-ups, we encourage you to sign up for our daily newsletter – it’s free and if you don’t like it, you can unsubscribe with just 2 clicks. If you sign up today, you’ll also get 7 days of free access to our premium daily Gold & Silver Trading Alerts. Sign up today!
Thank you.
Paul Rejczak
Stock Trading StrategistSunshine Profits – Effective Investments through Diligence and Care
THIS ARTICLE ORIGINALLY POSTED HERE.


 – David Skarica")