
Ladies and Gentlemen, it has finally happened! The current expansion already goes on for 121 months, which means that the previous record of 120 months is now history. Thus, it has become the longest economic boom in the U.S. history. Should we celebrate now? Or should we worry, as all good things come to an end, and whatever lasts long, ends up even faster? Is the U.S. economy in a good shape or on the edge of collapse? Let’s make an assessment!
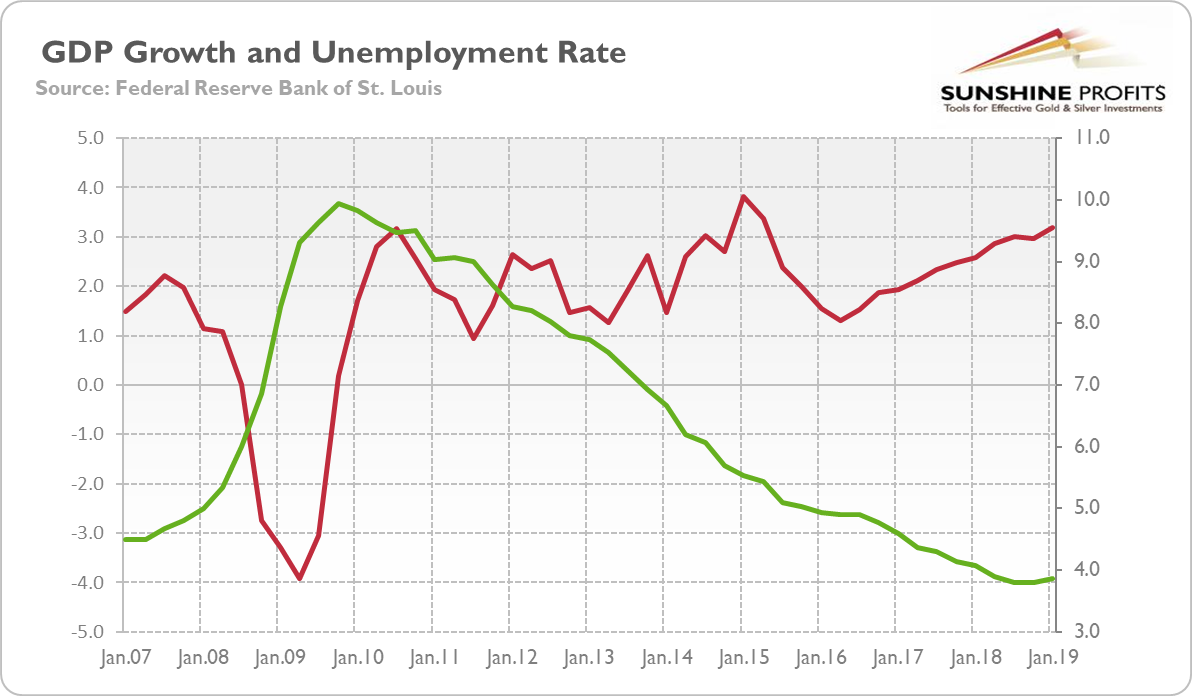
First of all, the GDP growth is at a robust pace of 3 percent, while the unemployment rate is at 3.6 percent, a 50-year low, as one can see in the chart below. It does not look like any replay of the Great Recession, does it? Actually, the rate of employment growth is exceptionally rich, much stronger that the mere GDP growth would predict.
Chart 1: The real GDP growth (red line, left axis, in % y-o-y) and the unemployment rate (green line, right axis, U3, in%) from Q1 2007 to Q1 2019.

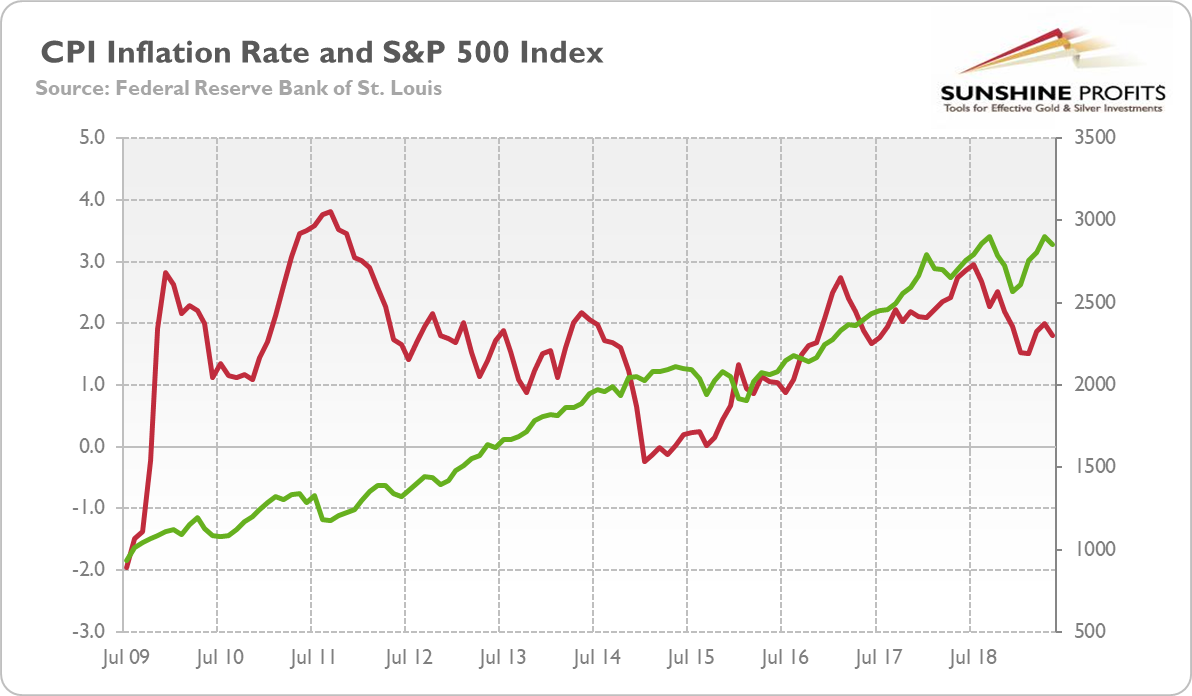
Moreover, inflation is slightly below 2 percent, which is definitely not a problem for the economy, while the stock market is up by more than 50 percent since 2016, as the chart below shows. Actually, solid GDP growth and low inflation constitute Goldilocks economy, which is welcomed by the Wall Street (we have analyzed the Goldilocks economy in the June edition of the Market Overview).
Chart 2: The CPI annual rate (red line, left axis, in %) and the S&P 500 Index (green line, right axis) from July 2009 to May 2019.

Last but not least, retail sales rebounded in May, while industrial production remains solid (see the June 18 edition of the Gold News Monitor). As we have examined in the March edition of the Market Overview, most of the recessionary indicators do not flesh red. Hence, we remain rather optimistic about the outlook for U.S. economy. No doubt that it appears in a much better shape than Japan or the Eurozone. But even according to the absolute criteria, there is no immediate danger on the horizon.
Does it mean that we do not see any threats? Of course not! There are three main risks. First, the inversion of the yield curve. Although the yield curve could indeed lose some of its predictive power, this is something what the pundits used to say before each financial crisis. “This time is different”, they announced recklessly just to be surprised by the good old crash. Therefore, we take the recent inversion of the yield curve seriously, but we are far from panicking.
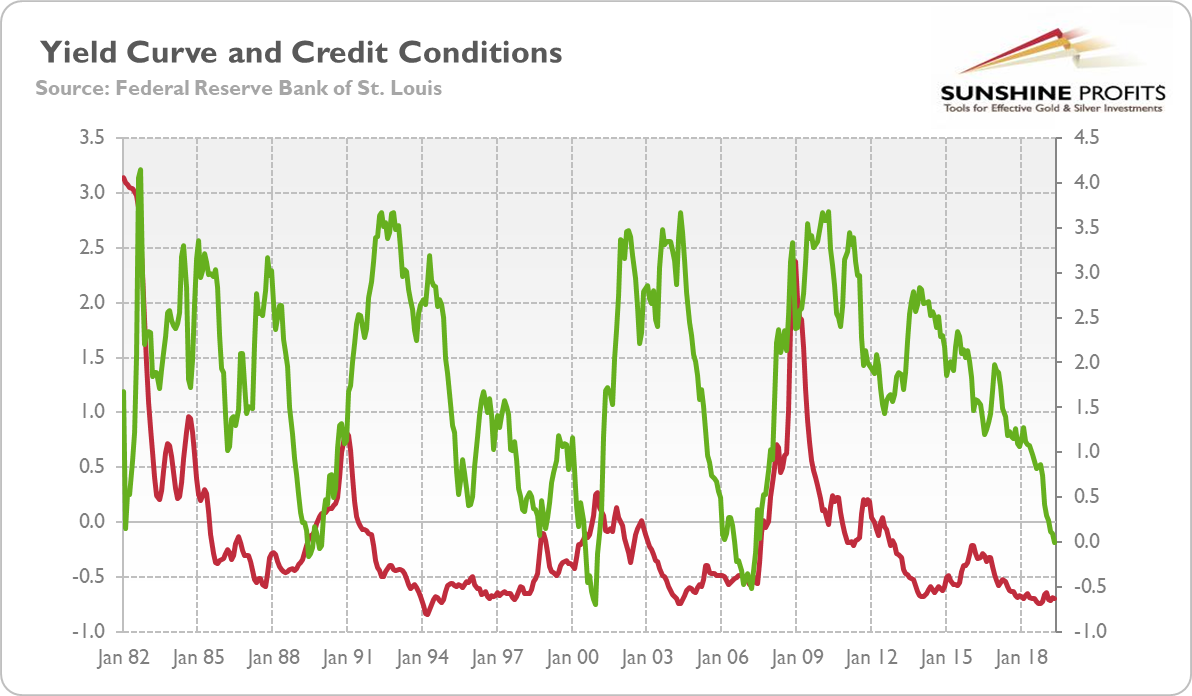
Why? It is because we do not see a corresponding tightening in credit conditions. Historically, the yield curve inverted because of the liquidity shortage. That happens when the indebted entrepreneurs begin to sustain losses and turn so desperate for a loan to finish their investment projects that they are willing to pay more for a short-term loans than for a long-term obligation. However, as the chart below shows, the credit conditions remain easy (the red line on the chart below stays below zero, which indicates looser than average credit conditions), so the recent inversion of the yield curve does not necessarily signal the upcoming recession, at least not yet. But the yield curve-related risks have clearly increased recently, so keeping an eye out for this indicator is certainly worthwhile.
Chart 3: Yield curve (green line, right axis, spread between 10-year and 3-month Treasuries, in %) and the Chicago Fed National Financial Conditions Credit Subindex (red line, left axis, index) from January 1982 to May 2019.

Second, trade wars. We still believe that Trump and Xi will eventually reach a deal, especially that they announced trade truce in June. Should they fail to do that, new tariffs and other protectionist measures could significantly disrupt the global supply chains, affecting negatively the corporate profits and the whole economy.
And, third, debt. The scale of private and public debt is dangerously outrageous, in many cases even higher than before the Great Recession. Total public and private debt in many countries is above 320 percent of GDP, according to the IMF. It goes without saying that the debt-driven economic expansion is not sustainable. At current interest rates, the debt seems to be cheap and worth of loading on balance sheet. However, the low bond yields do not reflect low risk in general, but rather financial repression. When the central banks normalize their monetary policy, the mirage of low yields will disappear.
What does our overview imply for the gold market? The U.S. economic picture is better than many people think. While it’s not perfect, it’s not as bad as widely believed. It suggests that the economy has still some room to run. Bad news for the gold bulls, we know. The consensus is that America is headed for a recession by the end of 2020. We are not yet convinced. There will be a growth slowdown, that’s very likely, given that the effect of fiscal stimulus will wane, but a downturn is another kettle of fish.
However, the economic slowdown combined with the fears of recession might be enough to increase the safe-haven demand for gold. Many people buy the yellow metal when the economy is already in the recession, but smart money flows into the precious metal sector in advance.
If you enjoyed the above analysis and would you like to know more about the expansions, recessions, and gold, we invite you to read the July Gold Market Overview report. If you’re interested in the detailed price analysis and price projections with targets, we invite you to sign up for our Gold & Silver Trading Alerts. If you’re not ready to subscribe yet and are not on our gold mailing list yet, we urge you to sign up. It’s free and if you don’t like it, you can easily unsubscribe. Sign up today!
Thank you.
Arkadiusz Sieron
Sunshine Profits’ Gold News Monitor and Gold Market Overview Editor
THIS ARTICLE ORIGINALLY POSTED HERE.


 – David Skarica")