
Bear Market History
It is common in the financial media to define a bear market happening once the stock market falls 20% or more. Of course by the time it falls that much knowing it then doesn’t do you a whole lot of good!
So I have a better definition of whether or not the market is in a bear market or not using simple technical analysis.
I’ll get to that in a second, but first that 20% rule people use is useful for one thing.
That is to know how bad bear markets typically are on a historical basis.
Well here are all of the times that the S&P 500 has dropped 20% or more and what happened.

When you put it all together ever since 1929 there have been 25 Bear Markets and that’s a lot of bear markets.
Just one of them is enough to devastate a portfolio.
The facts are:
– The average Bear Market period lasted 10 months
– The average Bear Market loss was -35% (The smallest loss was -21% in 1949, and the largest loss was -62% registered in 1932)
– Average frequency of Bear Markets since 1929 is every 3.4 years
– The last Bear Market ended in March 2009.
There has not been a big bad bear market then in a very long time and one is going to come again someday no matter what you might here stock market bubble bulls and CNBC talking heads say.
So what do you do?
Bear Market ETF
Well you can hedge yourself from bear market losses using an exchange traded fund that is designed to go up when the stock market goes down.
SDS is the most popular one that people trade for this and it is a 2X short ETF for the S&P 500.
The problem is it has a decay factor because of the way ultra ETF’s are designed.
Another good ETF is HDGE that simply is a short selling managed ETF.
The people running that ETF pick out stocks to short for the ETF.
I do not own bear market ETF’s all of the time in my account and only buy them when I think a drop is coming or a bear market at attack is around the corner.
In order to figure out what the market is likely to do over the next six months I use what is called stage analysis. It’s a simple way to do an intermediate-term market trend analysis to generate a reasonable six months out forecast.
Stock Market Stage Analysis of Bull and Bear Markets
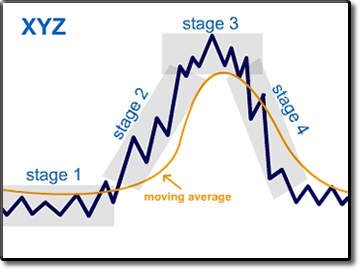
There are four stages to a financial market cycle in a stock or entire financial market. As you know you can have a bull market. Before a bull market starts though you usually have a stage one basing phase in which a market simply goes sideways and builds a base.
Then it breaks out and begins a full blown stage two bull market that typically lasts for several years. Then there is a stage three topping phase and then a stage four bear market.
There are various technical indicators you can use to determine when these stages are coming to an end so you can make the proper adjustments. That’s a topic a little too big to get into now, but we can look at the basics right now. I can quickly show you one important indicator to watch to identify the trend the market is in.
That’s the long-term 150-day moving average, which is simply a line plotted on a chart using the average price number of the past 150-days.
In a bull market this line slopes up on a chart and the price of the market tends to stay above it, so it acts as a nice price support level in a bull market to make for a good entry point timing mechanism.
In a bear market this line slopes down on a chart and the price of the market tends to stay below it and it acts as resistance.
So you can use this moving average to quickly identify the trend of a market. Then you can know if you should be bullish on a market or not.
Take a look at the S&P 500.

Ok you can see from this chart how the S&P 500 began a stock two bull market in 2009 and how the 150 and 200-day moving averages have acted as support since then.
However in the past two years the right of ascent of those moving averages dissipated and they have actually been going sideways.
This is a sign that a long drawn out stage three top is actually going on with the stock market.
Another sign is that the number of stocks participating in the market rallies when they happen is getting narrower.
This is something I monitor in updates and keep my pulse on because rapid disintegration in several internal indicators that I follow often precedes stock market drops.
This happened in August of 2015 and in December of 2015 ahead of the January 2016 dump.
I actually was able to bet against some stocks ahead of those drops to benefit.
This Fall these indicators were weakening ahead of the Presidential election, but once Trump won the market took a positive turn higher – for now.
So this is where we are as I write this heading into the end of the year.
Internals are starting to falter, but not in a significant enough manner to expect a true drop to happen until 2017.
Bear Market 2017
So that leaves us with the possibility that a stage three market phase now can lead to a true bear market in 2017.
Now this isn’t a certainty, but it is a possibility and whether it happens or not we should be able to know ahead of time by monitoring the overall structure of the market and the internal indicators.
If you are new to this website then get my future action updates by joining my free email list. You’ll also get my latest update on gold. To do that join now by getting on my free email list below.


")
 – David Skarica")