Over the past few weeks we have seen a lot of weakness in the markets. It was nothing actually new, but something that simply became apparent when the market averages took a dip starting around Thanksgiving. I say it was nothing new, because most stocks inside the stock market actually peaked out in the summer and most fad stocks in fact are already in bear markets, trading below their 200-day moving averages.
Last week, though, the S&P 500 managed to pop back up to a new high going into Christmas.
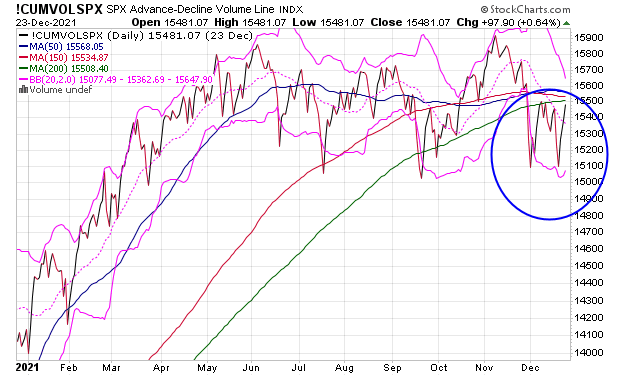
Check out the chart.

On the bottom of this chart is the IWM ETF for the Russell 2000 and Cathie Wood’s ARK Fund ETF, which still remains one of the most popular most owned positions among Robinhood traders. You can see how poorly both are trading in comparison with the S&P 500.
What is next?
Expect this poor performance in the fad stocks to simply continue next year.
In fact, I think the breakdown in the Russell 2000 and the number of stocks above their moving average represents the end phase of a stage three top that will lead to a new bear market next year.
But for a bear market to come for the S&P 500 it must first follow the ARK down to trade below its 200-day moving average.
It’s not doing that yet.
The bounce back up could hold the S&P 500 up with a sideways to up trend into New Years and even into much of January for the next batch of earnings report.
However, notice that last week’s bounce came on weak volume.
And also notice that the accumulative volume A/D line barely went up last week at all even with the market pop, which is another negative divergence.
Caution is still the order of the day for the market, and it has been in my view since the summer, when the internals began to trend down, with the percentage of stocks above their 200-day moving average peaking and things such as ARK sinking. That said the S&P 500 popped back up. It could even have a quick exhaustion rally in the first quarter, like it did in early 2018, before it has the type of drop that gets people’s attention. The reality is, few are actually looking at the market charts now, they are either glued to their Robinhood apps, which show them daily price changes, or are on vacation.
-Mike
")


")

