
We have seen some wild intraday movements in the price of gold so far this year. On the first trading day of the year gold, silver, and mining stocks surged to be the top gainers of that trading day only to turn down by the end of that week and fall more last week.
I got a lot of emails about these moves, with some asking if Bitcoin gains are causing people to sell gold and others wondering if recent rises in long-term Treasury bond yields are forcing people out of gold. I showed in a post a week ago though that there is no visible mathematical correlation between gold movements and Bitcoin or bond moves. In fact there is a slight positive correlation between gold and Bitcoin. The important thing about the bond market is how it is influencing the US dollar index, and an oversold condition in the US dollar is in my view the main contributor to the recent pull back in gold.
I do not see this as a major event though, because the US dollar is locked in a bear market below its 200-day moving average simply bouncing and I expect it to peak soon and make new lows in the coming weeks or months. In fact the US dollar index got extremely oversold in early August and popped a few days and floated sideways for several weeks before breaking down in mid-November.
Look for something like that to happen again. I looked through the major mining stocks and some look like they are simply going to go sideways at current levels, some look likely to retest their September lows, with only a few poised to rally hard at the moment. But it looks like the overall setup is for sideways trading for the entire sector.
We all watch these markets trade day by day and when a big move happens the media and our minds look for big explanations for it, but you have to step back from things time to time to look at the big picture to really understand what is going on.
A market or asset, such as gold and silver, is either in a bear market, bull market, or a phase in between (topping or base building). I call these stages and they are a main theme of my book Strategic Stock Trading.

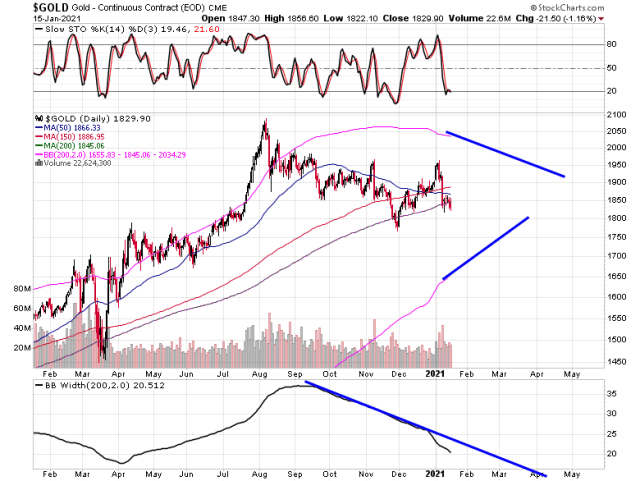
If we look at a long-term chart of gold we can get a clear picture of what stage gold prices are in and why they are trading the way they are trading.

Gold is currently trading in a stage two bull cycle, trading above its 200 and 150-day moving averages with those acting as support. The last such period was from 2002 to early 2012. I first bought mining stocks in the first quarter of 2002.
After 20102 gold went into a bear market that ended with a price bottom in the summer of 2015. Gold then went through a long basing phase that lasted into the end of 2018 in which $1400 acted as price resistance and $1200 as price support.
This March gold fell to $1450 during the stock market crash of over 33% in the S&P 500 and then rallied all the way up to close to $2100 in the space of roughly four months. That’s a large gain in a short amount of time.
I have put the 200-day Bollinger Bands on the above chart enveloping the price and their width indicator on the bottom. These measure the real price volatility for gold using its 200-day average price. It’s a long-term measurement and that width indicator went from 10 in 2018 to close to 40 at gold’s price peak of 2020.
Big price movements up in a bull market eventually lead to either a sharp correction or a period of a drawn out period of sideways consolidation. It’s simple profit taking and a natural and healthy part of a bull market. Those in mining stocks in 2016 saw what a sharp correction is like, but now we appear to be simply continuing a long-drawn out consolidation sideways phase in gold that started this August.
If you look at the above chart and what happened with gold from 2002 to 2012 there were many such phases. Some lasted over a year, but all came to an end when the 200-day Bollinger Band width indicator fell below 20 sometimes dropping all the way down to 10.
That width indicator peaked last year and is now trading at 26.31 and is heading down towards 20. This is telling us that we saw a lot of volatility (which simply means speed of price movement) in gold when it rallied up to $2100 last year, which is now fading and going back down to its mean.
The recent moves in gold (and silver) need to be understood in the context of this sideways phase that is causing volatility to actually fade in gold. It’s a process that could last for several more weeks or months and will coincide with the working off of the recent oversold conditions in the US dollar index. Once it’s over look for another big huge rally to start, one that won’t just be a rally, but a new leg up in the gold bull market and will drive the best mining stocks up to the moon.
How long will this consolidation last?
Probably into the Spring.
A closer look at the daily chart of gold and these indicators show that on their current trajectory the 200-day Bollinger Bands will get into the 10-15 range by April. Gold, silver, and mining stocks have already been going sideways and consolidating now for 5 months in a range. Two or three more would be no big deal. It means buying dips near support is the optimal way to accumulate or get in for the first time and not buying on big up days or up weeks.
One stock, that I own, that has had its volatility shrink faster than the other mining stocks is NEM.

NEM has been defined by sideways price action really since last May. I believe as far as the big caps go its likely to be one of the first breakout and rally. I don’t say that because I own it, because I own almost all of the others.
This is going to be a fascinating year in the markets. The most interesting interview I saw on the markets last week was one by Jeffrey Gundlach on CNBC.
I don’t agree with 100% of Gundlach’s views, but I find his talk on his expectations for bonds interesting and the big question will be when will “yield control” happen. Will it take a 20% decline in the future in the S&P 500 to cause the Fed to announce yield control or a simple further rise in yields to some point to make them do it?
I don’t have the answer, but I do believe that we are heading for higher inflation as Gundlach does. And this why I am not trying to jump in and out of gold. If I was 100% invested with all my money in gold and mining stocks I’d likely get shaken out during this sideways consolidation. But with a manageable position and diversification frankly the movements aren’t a big deal to me. When you are 100% invested in a market it becomes very difficult to hold during a correction and if you are going on margin real declines like what happened with the S&P 500 in the spring of last year wipe you out.
-Mike


 – David Skarica")