
The U.S. stock market indexes gained 0.3-0.5% on Friday, slightly extending the uptrend, as investors’ sentiment remained bullish following the quarterly earnings releases. The S&P 500 index retraced all of its medium-term downward correction of 20.2% recently. The broad stock market’s gauge is now less than 0.1% below September the 21st record high of 2,940.91. Both the Dow Jones Industrial Average and the Nasdaq Composite gained 0.3% on Friday.
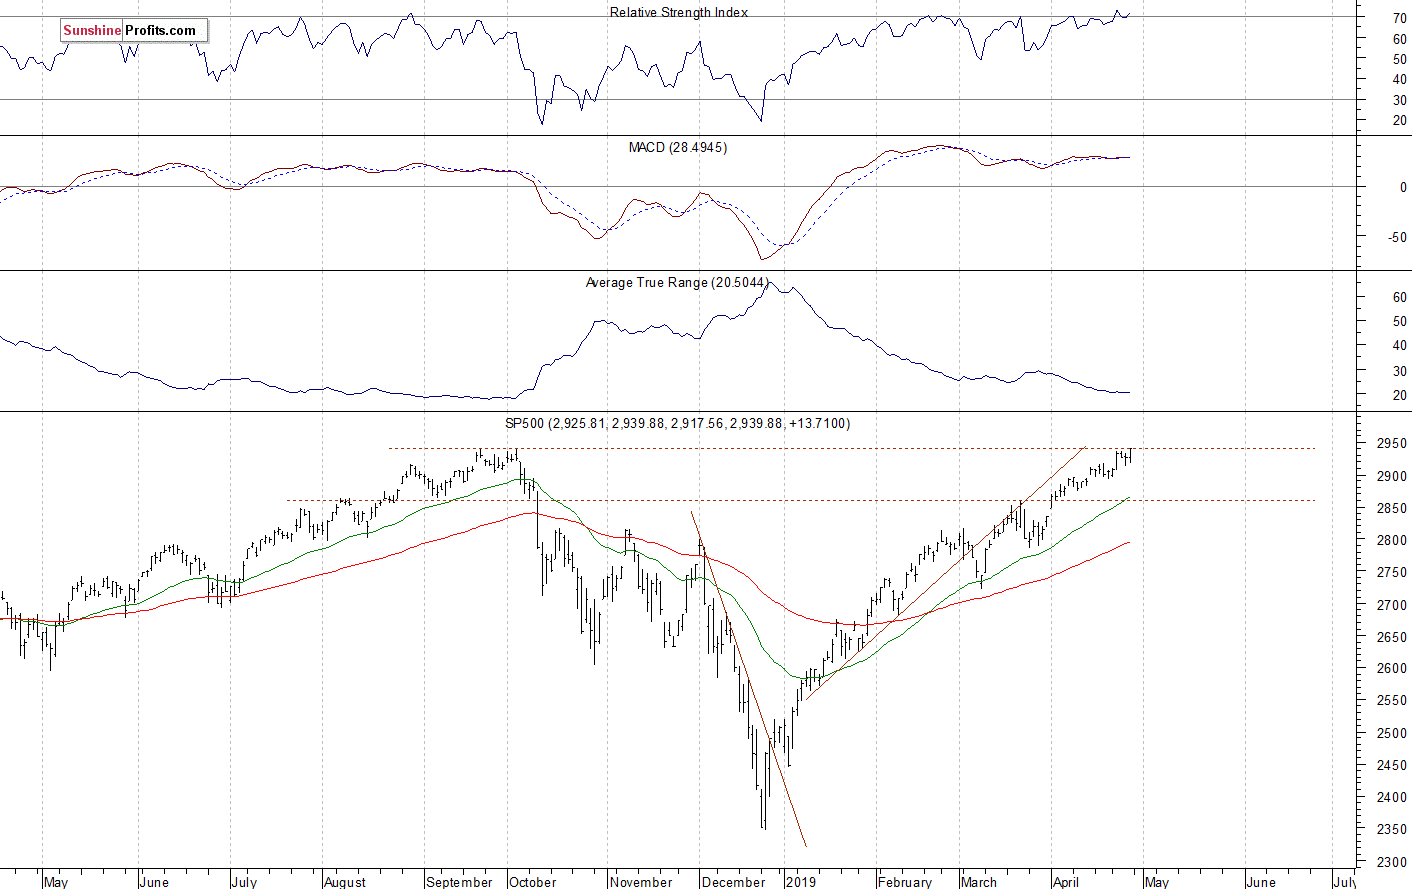
The nearest important resistance level of the S&P 500 index remains at around 2,940, marked by the mentioned record high. The next resistance level is at 1,950. On the other hand, the support level is at 2,920, marked by the recent resistance level. The support level is also at 2,900.
The broad stock market retraced all of its December sell-off and it broke above the medium-term resistance level of around 2,900 recently. So is it still just a correction or a new medium-term uptrend? We may see an attempt at getting back to the record high. There have been no confirmed negative medium-term signals so far. The index got very close to its last October all-time high, as we can see on the daily chart:

Mixed Expectations, Stocks Remain at Record Highs
Expectations before the opening of today’s trading session are virtually flat, because the index futures contracts trade 0.1 % below their Friday’s closing prices. The European stock market indexes have lost 0.1-0.3% so far. Investors will wait for some economic data announcements today: Personal Income, Personal Spending at 8:30 a.m. They will also wait for more quarterly corporate earnings releases. Stocks will likely extend their short-term consolidation along the last year’s record high. There have been no confirmed negative signals so far. However, we can see some short-term technical overbought conditions.
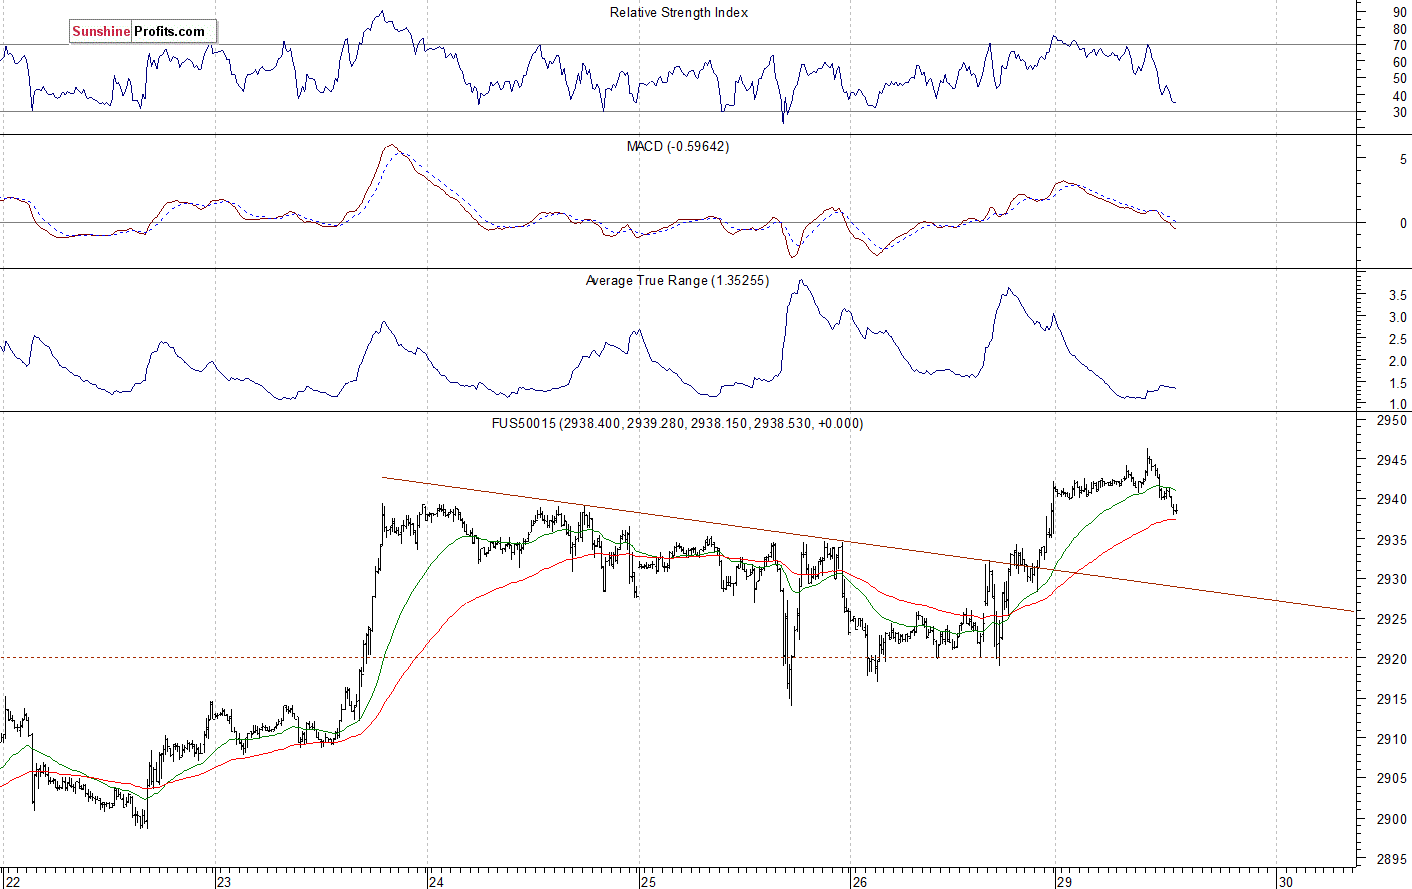
The S&P 500 futures contract trades within an intraday consolidation, following an overnight advance. The nearest important resistance level is now at around 2,945-2,950. On the other hand, the support level is at 2,930, among others. The futures contract remains close to the new high, as the 15-minute chart shows:

Nasdaq Above 7,800
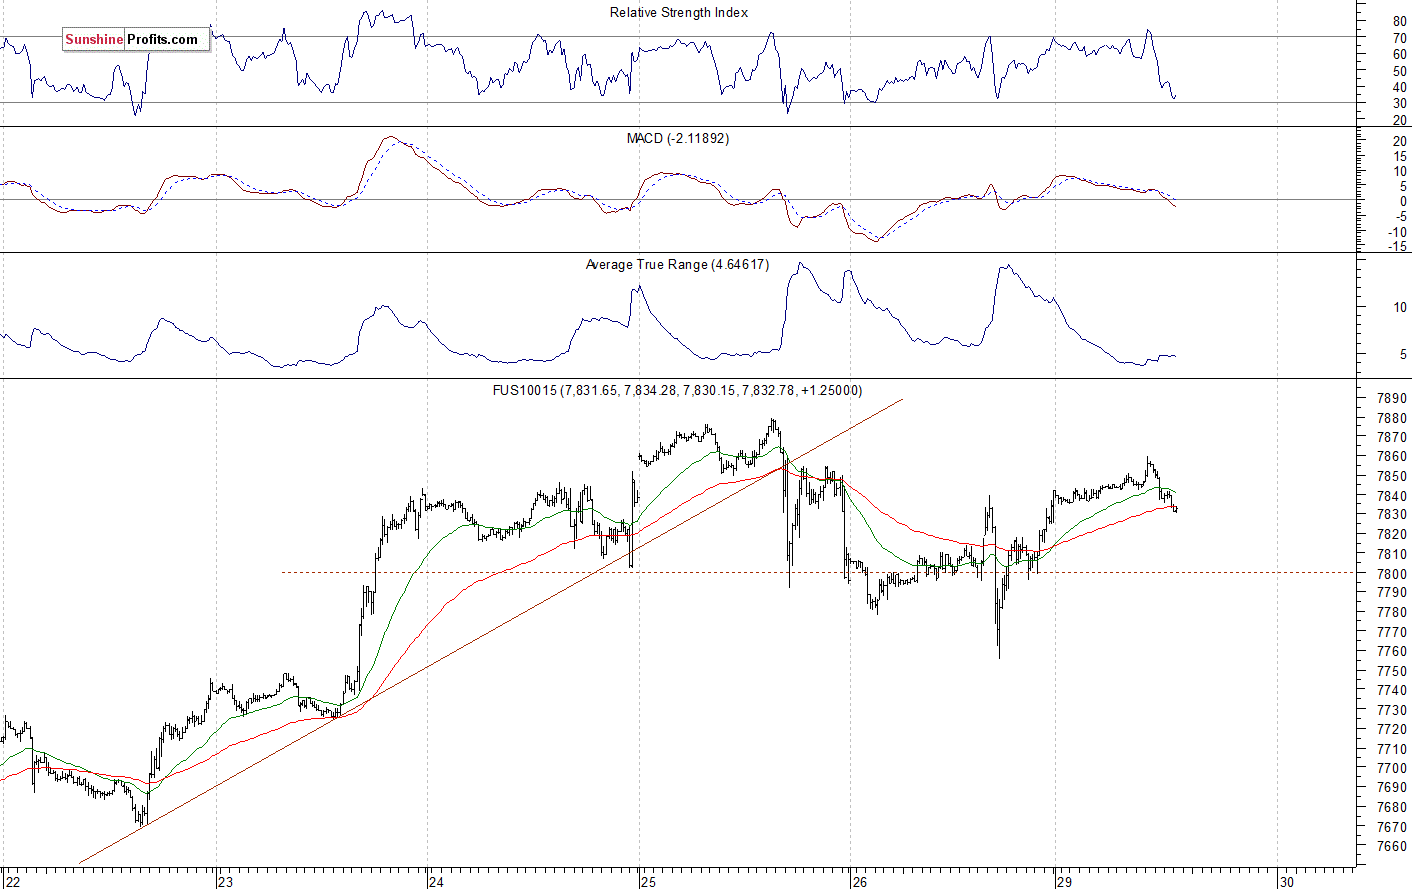
The technology Nasdaq 100 futures contract reached the new record high recently, as investors reacted to the quarterly corporate earnings releases. But then it retraced some of the short-term rally. The resistance level is at 7,850-7,900. On the other hand, the support level is at 7,750-7,800. The Nasdaq futures contract continues to trade within a short-term consolidation, as we can see on the 15-minute chart:

Big Cap Tech Stocks – Uncertainty Following Rally
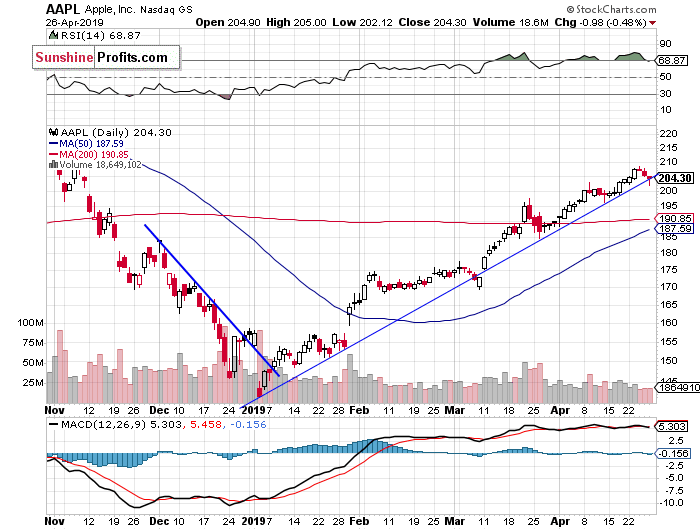
Let’s take a look at the Apple, Inc. stock (AAPL) daily chart (chart courtesy of http://stockcharts.com). The stock accelerated its uptrend recently and it broke above the $200 level. On Wednesday the market reached another new medium-term high, but then it broke slightly below the medium-term upward trend line:

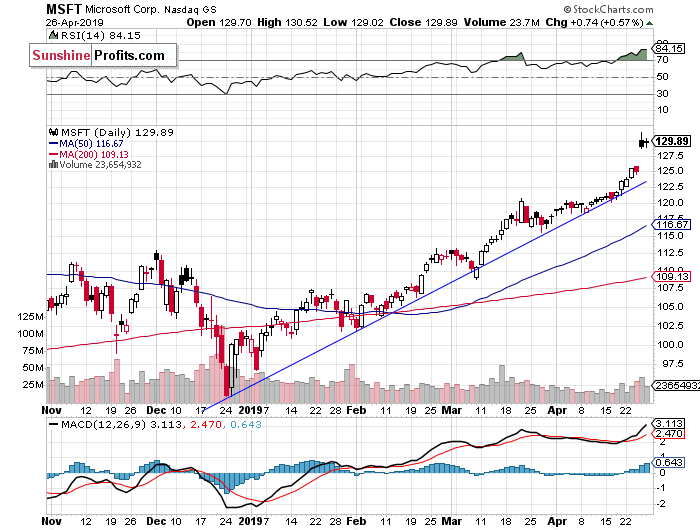
Now let’s take a look at the daily chart of Microsoft Corp. (MSFT). The stock accelerated its uptrend on Thursday, as it reached the new record high of $131.37. Investors reacted to the Wednesday’s better-than-expected quarterly earnings release. For now, it looks like blow-off topping pattern. We can see some clear technical overbought conditions:
Dow Jones Going Sideways
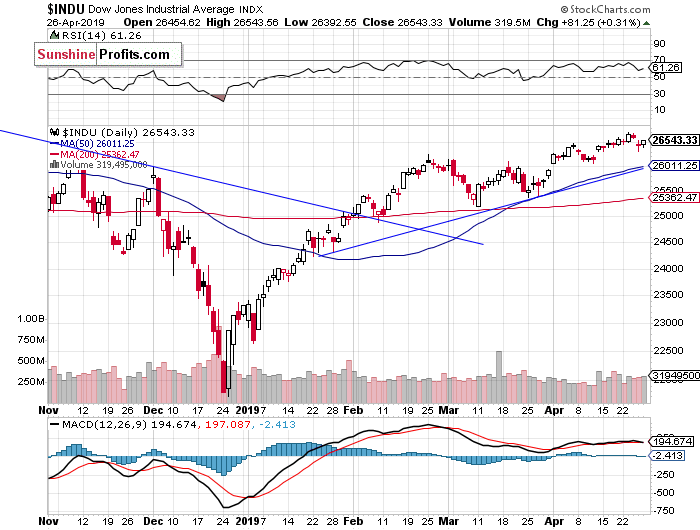
The Dow Jones Industrial Average was relatively weaker than the broad stock market recently. The resistance level remains at around 26,800-27,000, marked by the last year’s topping pattern and the record high of 26,951.8. On Tuesday the blue-chip stocks’ gauge reached the new medium-term high. But then it traded closer to the 26,500 mark again. There have been no confirmed negative signals so far. However, we can see some negative technical divergences:

The S&P 500 index broke above its short-term consolidation last week and it got very close to the record high of 2,940.91. The broad stock market may reach new record highs, as investors’ sentiment remains very bullish following economic data, quarterly corporate earnings releases. However, we can see short-term technical overbought conditions that may lead to a downward correction at some point.
If you enjoyed the above analysis and would like to receive free follow-ups, we encourage you to sign up for our daily newsletter – it’s free and if you don’t like it, you can unsubscribe with just 2 clicks. If you sign up today, you’ll also get 7 days of free access to our premium daily Gold & Silver Trading Alerts. Sign up today!
Thank you.
Paul Rejczak
Stock Trading Strategist
Sunshine Profits – Effective Investments through Diligence and Care
THIS ARTICLE ORIGINALLY POSTED HERE.
")

")
")

